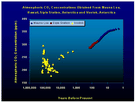
Direct measurements of atmospheric CO2 concentration have been made since the late 1950s at Mauna Loa, HI and near the South Pole. Prior concentrations of CO2 have been inferred from air samples trapped in ice cores drilled from locations in Greenland and Antarctica. These ice core samples have produced data sets of carbon dioxide concentration spanning the last 200,000 years (Boden et al., 1994), a composite of which is shown in the figure below.

As can be seen from this graph, earth's atmospheric carbon dioxide concentration dropped below 200 ppm during the midst of the last ice age, after which it recovered to a value of about 280 ppm. It subsequently remained fairly constant, but with the dawning of the Industrial Revolution in the late 1700s, it began to rise again and stands today at a value close to 370 ppm (Houghton et al., 1996).
The apparent correlation between CO2 and temperature over portions of this record is often presented as "evidence" that future increases in CO2 will result in catastrophic global warming. However, as we pointed out in our Volume 2 Number 7 Editorial CO2 and Temperature: The Great Geophysical Waltz and in our Volume 2 Number 8 Climatological Review CO2 and Temperature: Ice Core Correlations, CO2-temperature trends over a much longer period of time (250,000 years) indicate that, contrary to current climate model implications, this simplistic notion has little real-world data to support it. Following the penultimate deglaciation, for example, atmospheric CO2 concentrations exhibited no net change for approximately 15,000 years, during which period air temperatures dropped all the way back to values characteristic of glacial times (Fischer et al., 1999). Then, when CO2 finally began to decline, air temperatures remained constant for a few thousand years, after which they actually rose for about 6,000 years. And even when the two parameters increased in unison, as they did during the three most recent glacial terminations, temperature always rose first, followed by CO2 concentrations some 400 to 1,000 years later.
Clearly, the concomitant increase in atmospheric CO2 and air temperature over the last century or so proves nothing of a cause-and-effect nature. When all available CO2 and temperature records are analyzed, one can find much longer periods of absolutely no correlation and even opposing trends.
To access a file of the data from which the above graph was constructed, click here.
References
Fischer, H., Wahlen, M., Smith, J., Mastroianni, D. and Deck B. 1999. Ice core records of atmospheric CO2 around the last three glacial terminations. Science 283: 1712-1714.
Houghton, J.T., Miera Filho, L.G., Callander, B.A., Harris, N., Kattenberg, A. and Maskell, K. (Eds.). 1996. Climate Change 1995: The Science of Climate Change. Cambridge University Press, Cambridge, UK.
Boden, T.A., Kaiser, D.P., Sepanski, R.J. and Stoss, F.W. (Eds.). 1994. Trends '93: A Compendium of Data on Global Change. ORNL/CDIAC-65. Carbon Dioxide Information Analysis Center, Oak Ridge National Laboratory, Oak Ridge, Tennessee.
Last updated 1 January 2000


