


Real-Time Results
Real-Time Results: Week 8
 At the end of this past week, two of the four pea plants in the low-CO2 unit are totally dead, one is approximately 75% dead, and one 25% dead. Although showing signs of stress, none of the plants in the mid-CO2 unit have died; and all of the plants in the high-CO2 unit look good, although reduced in size from what would have been expected under normal outdoor conditions. Two of the high-CO2 unit plants also have a single flower blooming.
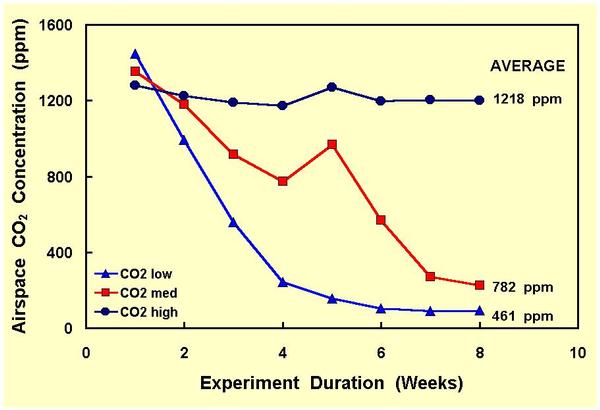
 As shown in Figure 1, we ended up with a good range of average internal airspace CO2 concentrations. The experiment-long value for the high-CO2 unit was 1218 ppm, while that of the mid-CO2 unit was 436 ppm lower at 782 ppm, and that of the low-CO2 unit was 321 ppm lower still at 461 ppm.
 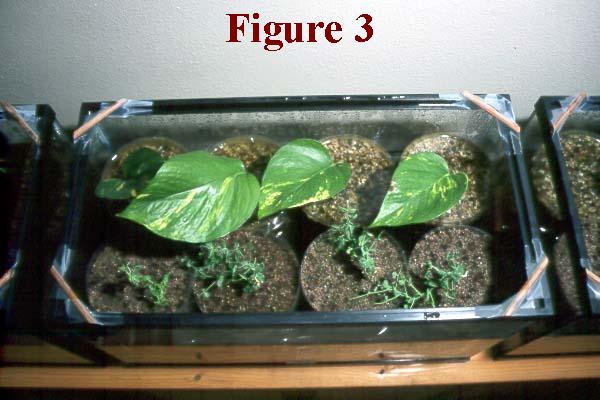 In addition, it appears that the mean CO2 concentration of the last two weeks in the low-CO2 unit (92 ppm) is the value at which death occurs in the peas we studied under the environmental conditions of light, temperature, soil moisture and nutrient content that prevailed in our experiment, which is 369 ppm less than the average experiment-long value of this unit.
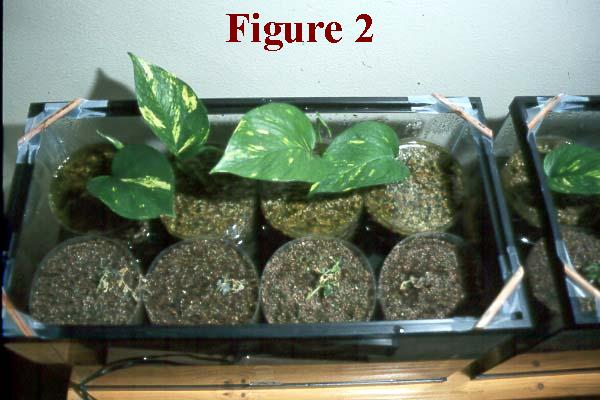
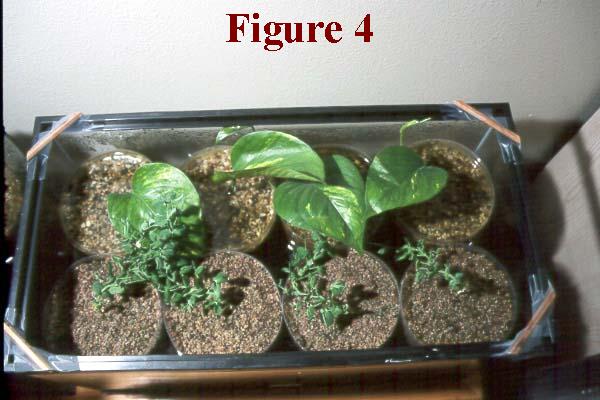 At this point in time, the plants are ready to be harvested. We have thus removed the upper aquarium from each unit and will now begin this task. Photographs of the lower halves of each unit are depicted in Figures 2, 3 and 4, showing the size and condition of the plants just prior to this operation. We hope to be able to display our final results next week.