


Real-Time Results
Real-Time Results: Week 4
The airspace CO2 concentration trends developed over the first three weeks of the experiment continue to develop (see accompanying figure); and the data now clearly demonstrate the virtue of waiting about a month after the initiation of Pothos growth before introducing the pea seeds. 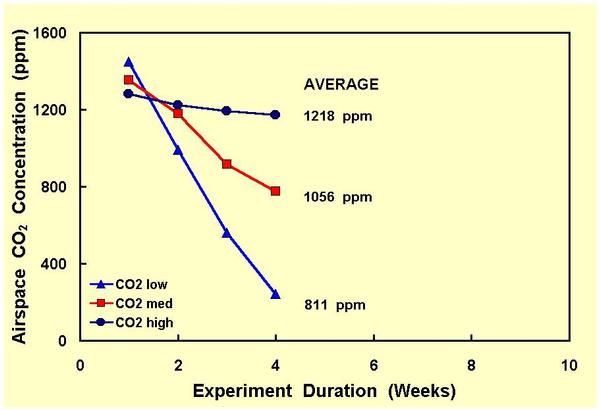 If such had been done in the case of this experiment, the pea seedlings would have emerged into airspaces with CO2 concentrations of approximately 243, 775 and 1173 ppm, which are the values we obtained over this fourth week of our study, whereas the mean CO2 concentrations to this point of the experiment are instead 811, 1056 and 1218 ppm - all quite high and not greatly different from each other. Nevertheless, if the concentration trends developed to this point in time continue, we should still end up with a reasonable range of mean values. Hence, we plod on.