


Center Experiment #3: Real-Time Results
Real-Time Results
Real-Time Results: Week 3
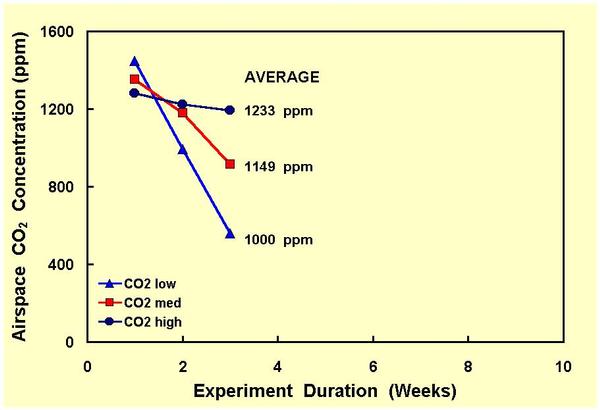 To better appreciate the divergent paths being taken by the airspace CO2 concentrations of our three experimental units, we are this week initiating a plot of their progressions through time. The accompanying figure thus depicts the results of our first three weeks of airspace CO2 concentration measurements plotted on a graph of time duration that is hopefully long enough to take us all the way to the conclusion of the experiment. This graph will hereafter be updated weekly.