


Periodically, individual scientists and groups of scientists analyze global sets of sea level data to see if there is any indication of a dramatic increase in the mean rate-of-rise of the global ocean surface in response to the supposedly unprecedented warming of the planet over the course of the 20th century and the initial phase of the 21st century, which latter phenomenon the world's climate alarmists claim should be accelerating global sea level rise and leading to catastrophic coastal flooding throughout the world. Hence, we here provide a brief summary of the findings of several such studies that we have reviewed over the past several years.
Cazenave et al. (2003) studied climate-related processes that cause variations in mean global sea level on inter-annual to decadal time scales, focusing on thermal expansion of the oceans and continental water mass balance; and in doing so, they determined that the rate of thermal-induced sea level rise over the prior 40 years was about 0.5 mm/year. From early 1993 to the end of the 20th century, however, analyses of TOPEX-Poseidon altimetry data along with the global ocean temperature data of Levitus et al. (2000) yielded rates-of-rise that were approximately six times greater than the mean four-decade rate, which suggested to them that "an acceleration took place in the recent past, likely related to warming of the world ocean." However, as they alternatively noted, "the recent rise may just correspond to the rising branch of a decadal oscillation," noting that "satellite altimetry and in situ temperature data have their own uncertainties and it is still difficult to affirm with certainty that sea level rise is indeed accelerating." In fact, they cited the work of Nerem and Mitchum (2001) as indicating that "about 20 years of satellite altimetry data would be necessary to detect, with these data alone, any acceleration in sea level rise."
Morner (2004) provided a more expansive setting for his analysis of the subject by writing that "prior to 5000-6000 years before present, all sea level curves are dominated by a general rise in sea level in true glacial eustatic response to the melting of continental ice caps," but he noted that "sea level records are now dominated by the irregular redistribution of water masses over the globe ... primarily driven by variations in ocean current intensity and in the atmospheric circulation system and maybe even in some deformation of the gravitational potential surface." With respect to the prior 150 years, for example, he reported that "the mean eustatic rise in sea level for the period 1850-1930 was [on] the order of 1.0-1.1 mm/year," but that "after 1930-40, this rise seems to have stopped (Pirazzoli et al., 1989; Morner, 1973, 2000)."
This stasis, in Morner's words, "lasted, at least, up to the mid-60s." Thereafter, with the advent of the TOPEX/Poseidon mission, Morner noted that "the record can be divided into three parts: (1) 1993-1996 with a clear trend of stability, (2) 1997-1998 with a high-amplitude rise and fall recording the ENSO event of those years and (3) 1998-2000 with an irregular record of no clear tendency." Most important of all, Morner indicated that "there is a total absence of any recent 'acceleration in sea level rise' as often claimed by the IPCC and related groups." And, therefore, he concluded that "there is no fear of any massive future flooding as claimed in most global warming scenarios."
About this same time, Church et al. (2004) used TOPEX/Poseidon satellite altimeter data to estimate global empirical orthogonal functions, which they combined with historical tide gauge data, to estimate monthly distributions of large-scale sea level variability and change over the period 1950-2000. Their resultant "best estimate" of the rate of globally-averaged sea level rise over the last half of the 20th century was 1.8 ± 0.3 mm/year. In addition, they noted that "decadal variability in sea level is observed, but to date there is no detectable secular increase in the rate of sea level rise over the period 1950-2000." What is more, they reported that no increase in the rate of sea level rise had been detected for the entire 20th century, citing the work of Woodworth (1990) and Douglas (1992).
Also publishing concurrently, Cazenave and Nerem (2004) summarized what was known shortly after the turn of the century about past and then-current rates of sea level rise because, in their words, "determining the rate of sea level change over the last century is critically important in order to determine if the present-day rate of sea level change has changed appreciably," which is something one would expect to have occurred if 20th-century global warming was truly as unprecedented as climate alarmists were claiming it was, bringing the planet to a level of warmth that they claimed was unprecedented over the past two millennia and within less than a degree of the all-time high temperature of the last million or more years.
What they learned from this endeavor was that (1) "the geocentric rate of global mean sea level rise over the last decade (1993-2003) is now known to be very accurate, +2.8 ± 0.4 mm/year, as determined from TOPEX/Poseidon and Jason altimeter measurements," and that (2) "this rate is significantly larger than the historical rate of sea level change measured by tide gauges during the past decades (in the range of 1-2 mm/year)."
However, as Cazenave and Nerem continued, "the altimetric rate could still be influenced by decadal variations of sea level unrelated to long-term climate change, such as the Pacific Decadal Oscillation, and thus a longer time series is needed to rule this out." They also noted that satellite altimetry had revealed a "non-uniform geographical distribution of sea level change, with some regions exhibiting trends about 10 times the global mean." In addition, they noted that "for the past 50 years, sea level trends caused by change in ocean heat storage also show high regional variability," which fact "has led to questions about whether the rate of 20th-century sea level rise, based on poorly distributed historical tide gauges, is really representative of the true global mean." Consequently, and in spite of the many new instruments and techniques that were being used to search for a global warming signal in global sea level data, Cazenave and Nerem wrote that "these tools seem to have raised more questions than they have answered."
One year later, noting that global climate models "show an increase in the rate of global average sea level rise during the 20th century," but that several prior studies (Douglas, 1991, 1992; Maul and Martin, 1993; Church et al., 2004; Holgate and Woodworth, 2004) had shown the measured rate of global sea level rise to have been rather stable over the past hundred years, White et al. (2005) conducted yet another analysis of the available data in an attempt to find the elusive predicted increase in the global sea level's rate of rise, comparing estimates of coastal and global averaged sea level for 1950 to 2000. And when all was said and done, their results confirmed the earlier findings of "no significant increase in the rate of sea level rise during this 51-year period," i.e., over the last half of the 20th century, including its last two decades, which were especially demonized by climate alarmists for their supposedly unprecedented rate of temperature increase.
Also working hard on the subject in this time frame were Lombard et al. (2005), who studied the thermosteric or temperature-induced sea-level change of the prior 50 years using the global ocean temperature data of Levitus et al. (2000) and Ishii et al. (2003). This work revealed that thermosteric sea level variations were typically dominated by decadal oscillations of the planet's chief ocean-atmosphere climatic perturbations (El Niño-Southern Oscillation, Pacific Decadal Oscillation and North Atlantic Oscillation); and in terms of the global mean, as they described it, thermosteric trends computed over 10-year windows "show large fluctuations in time, with positive values (in the range 1 to 1.5 mm/year for the decade centered on 1970) and negative values (-1 to -1.5 mm/year for the decade centered on 1980)."
In the mean, however, and over the full half-century period Lombard et al. investigated, there was a net rise in sea level due to the thermal expansion of sea water, but only because the record began at the bottom of a trough and ended at the top of a peak. In between these two points, there were both higher and lower values, so that one could not be sure what would have been implied if earlier data were available or what will be implied as more data are acquired.
Noting that sea level trends derived from TOPEX/Poseidon altimetry over 1993-2003 were "mainly caused by thermal expansion" and were thus "very likely a non-permanent feature," Lombard et al. concluded that "we simply cannot extrapolate sea level into the past or the future using satellite altimetry alone." Consequently, even the 50 years of global ocean temperature data we possessed at that time were insufficient to tell us much about the degree of global warming that may have occurred over the prior half-century, as any long-term increase in global sea level that may have been caused by the temperature increase was absolutely dwarfed by decadal-scale variability.
Concomitantly, Carton et al. (2005) introduced their study of the subject by noting that "recent altimeter observations indicate an increase in the rate of sea level rise during the past decade to 3.2 mm/year, well above the centennial estimate of 1.5-2 mm/year," noting further that "this apparent increase could have resulted from enhanced melting of continental ice," as climate alarmists often claim, "or from decadal changes in thermosteric and halosteric effects." Hence, they explored these opposing options "using the new eddy-permitting Simple Ocean Data Assimilation version 1.2 reanalysis of global temperature, salinity, and sea level spanning the period 1968-2001," and in doing so they determined that "the effect on global sea level rise of changing salinity is small except in subpolar regions." However, they found that warming-induced steric effects "are enough to explain much of the observed rate of increase in the rate of sea level rise in the last decade of the 20th century without need to invoke acceleration of the melting of continental ice." And as determined by Lombard et al., as described in the preceding paragraph, the high thermosteric-induced rate-of-rise of global sea level over the past decade is likely "a non-permanent feature" of the global ocean's transient thermal behavior. Consequently, and in harmony with the findings of Levitus et al. (2005) and Volkov and van Aken (2005), Carton et al. found no need to invoke the melting of land-based glacial ice to explain the observed increase in global sea-level rise of the past decade.
One year later and even more revealing was the globally-distributed sea level time series study of Jevrejeva et al. (2006), who analyzed information contained in the Permanent Service for Mean Sea Level database using a method based on Monte Carlo Singular Spectrum Analysis and who also removed 2- to 30-year quasi-periodic oscillations to derive nonlinear long-term trends for 12 large ocean regions, which they combined to produce the mean global sea level (gsl) and gsl rate-of-rise (gsl rate) curves depicted in the figure below.
Mean global sea level (top), with shaded 95% confidence interval, and mean gsl rate-of-rise (bottom), with shaded standard error interval, adapted from Jevrejeva et al. (2006).
In discussing their findings, Jevrejeva et al. said they show that "global sea level rise is irregular and varies greatly over time," noting that it is apparent that rates of sea level rise in the 1920-1945 period "are likely to be as large as today's." In addition, they reported that their "global sea level trend estimate of 2.4 ± 1.0 mm/year for the period from 1993 to 2000 matches the 2.6 ± 0.7 mm/year sea level rise found from TOPEX/Poseidon altimeter data." With respect to what the four researchers described as "the discussion on whether sea level rise is accelerating," therefore, their results pretty much answered the question in the negative.
The observations described above thus make us wonder why late 20th-century global warming - which climate alarmists describe as having been unprecedented over the past two millennia - cannot be detected in global sea level data. We are even more intrigued about the matter in light of the fact that the effects of the warming that led to the demise of the Little Ice Age - which by climate-alarmist contention should have been considerably less dramatic than the warming of the late 20th century - are readily apparent to the right of the vertical red line in the above figure.
Likewise, we are perplexed by the demonstrable fact that although the rising atmospheric CO2 concentration - which climate alarmists claim is primarily responsible for the supposedly unprecedented global warming of the late 20th century - experienced a dramatic increase in its rate-of-rise just after 1950 (shifting from a 1900-1950 mean rate-of-rise of 0.33 ppm/year to a 1950-2000 mean rate-of-rise of 1.17 ppm/year), the mean global sea level rate-of-rise did not trend upwards after 1950, nor has it subsequently exceeded its 1950 rate-of-rise. Clearly, these observations indicate that something is drastically wrong with the warped world-view of the world's climate alarmists.
Moving ahead another year, we report the findings of the study of Holgate (2007). In a previous paper, Holgate and Woodworth (2004) had derived a mean global sea level history from 177 coastal tide gauge records that spanned the period 1955-1998; and in an attempt to extend that record back in time another half-century, Holgate chose nine much longer high-quality records from around the world (New York, Key West, San Diego, Balboa, Honolulu, Cascais, Newlyn, Trieste and Auckland) to see if their combined mean progression over the 1955-1998 period was similar enough to the concomitant mean sea level history of the 177 stations to employ the mean nine-station record as a reasonable representation of mean global sea level history for the much longer period stretching from 1904 to 2003.
Continuing, and in comparing the sea level histories derived from the two data sets, Holgate found that their mean rates-of-rise were indeed similar over the second half of the 20th century; and this observation thus implied, in Holgate's words, that "a few high quality records from around the world can be used to examine large spatial-scale decadal variability as well as many gauges from each region are able to [do]."
As a result of this finding, Holgate constructed the nine-station-derived wavering black line in the figure below as a reasonable best representation of the 1904-2003 mean global sea level history of the world; and based on that history, Holgate calculated that the mean rate of global sea level rise was "larger in the early part of the last century (2.03 ± 0.35 mm/year 1904-1953), in comparison with the latter part (1.45 ± 0.34 mm/year 1954-2003)."
Another way of thinking about the century-long sea level history portrayed in the figure below is suggested by the blue curve we have fit to it, which indicates that mean global sea level may have been rising, in the mean, ever more slowly with the passage of time throughout the entire last hundred years, with a possible acceleration of that trend over the last few decades.
Cumulative increase in mean global sea level (1904-2003) derived from nine high-quality tide gauge records from around the world. Adapted from Holgate (2007).
In any event, and whichever way one looks at the findings of Holgate - either as two successive linear trends (representative of the mean rates-of-rise of the first and last halves of the 20th century) or as one longer continuous curve (such as we have drawn) - the nine select tide gauge records indicate that the mean rate of global sea level rise has not accelerated over the recent past (if anything, in fact, it's done just the opposite), when climate alarmists have incessantly claimed that (1) the earth warmed to a degree that is unprecedented over many millennia, (2) the warming resulted in a net accelerated melting of the vast majority of the world's mountain glaciers and polar ice caps, and (3) global sea level rose at an ever increasing rate. The real-world data-based results of Holgate - as well as those of all of the other studies included in this brief summary - clearly suggested that all of these claims are likely to be false.
Also with a pertinent paper published about the same time were Wöppelmann et al. (2007), who described a technique they developed for utilizing Global Positioning System (GPS) data, which they obtained from numerous GPS stations situated in close proximity to various tide gauges around the world, to correct the tide gauge records and thus obtain what they called a "set of 'absolute' or geocentric sea-level trends." And based on a number of criteria that had to be met by both the tide gauge and GPS stations, they ultimately used paired data sets from 28 locations that covered a time span of 5.9 years (1999.0-2005.7) to derive their final mean global result, after which they compared it with what they called the "most quoted" tide-gauge results of Douglas (1991, 1997, 2001), which had been corrected for the most common form of vertical land motion by means of theoretical models of Glacial-Isostatic Adjustment (GIA). So what did they thereby learn?
Whereas the data of Douglas yielded a mean global sea-level rate-of-rise of 1.84 ± 0.35 mm/year after correction for the GIA effect (Peltier, 2001), Wöppelmann et al. obtained a much lower mean value of 1.35 ± 0.34 mm/year when employing their correction for measured GPS vertical velocities. The sizable difference between these two results raises the question of how they compare with results obtained from other ways of estimating global sea level trends. And in this regard, the four researchers noted that Mitrovica et al. (2006) recently indicated there was a 1 mm/year contribution to sea-level rise from the melting of global land ice reservoirs, as well as a 0.4 mm/year contribution from thermal expansion of the global ocean (Antonov et al., 2005). And together, these two numbers yielded a value of 1.40 mm/year for the global ocean's total sea-level mean rate-of-rise, which was much closer to the 1.35 mm/year result of Wöppelmann et al. than to the Douglas-Peltier result of 1.84 mm/year.
Consequently, the mean global sea-level rate-of-rise calculated by Wöppelmann et al. appeared to resolve the "sea-level enigma" noted by Munk (2002), who had called attention to the sizable discrepancy that had existed at the time of his writing between estimates of climate-related contributions to sea-level change and what the observed value had been thought to be. And five years later, there was thus no longer any discrepancy between the two numbers. What is more, the global ocean's mean rate-of-rise was seen to be much slower than what had previously been believed to be the case.
Concomitantly, Wunsch et al. (2007) wrote that "given the widespread and generally consistent reports of global warming, melting glaciers, shoreline retreat, and the clear trend of the last 20,000 years, a compelling inference is that global-mean sea level is rising," and in this regard they noted that "the advent of high-accuracy satellite altimetry had led to estimates that, since about 1993, global average sea level had been rising at a rate of 2.8 ± 0.4 mm/year." Thus, they suggested that "it is desirable to buttress [this finding] through independent means," which is what they then set about to do.
"Using about 2.1 x 10⁹ observations of many different types, all individually weighted, during the period 1992-2004," together with "a 1° horizontal resolution 23-layer general circulation model," as the three researchers described it, they derived estimates of "regional trends in global sea level" that produced "a global mean of about 1.6 mm/year, or about 60% of the pure altimetric estimate, of which about 70% was from the addition of freshwater." However, they noted that there is "great regional variability in trend values, sometimes up to two orders of magnitude larger than the apparent spatial mean."
In light of these findings, therefore, the three researchers went on to state that "at best, the determination and attribution of global-mean sea level change lies at the very edge of knowledge and technology," and that "it remains possible that the database is insufficient to compute mean sea level trends with the accuracy necessary to discuss the impact of global warming -- as disappointing as this conclusion may be." And as a result, they concluded that the altimetry result was "currently untestable against in situ datasets." Nevertheless, it was of interest to note that the mass of data they analyzed provided a result that was only 60% as large as that suggested by the satellite altimetry data, which had always been larger than results obtained from nearly all prior in situ studies.
Moving on another year, Domingues et al. (2008) derived "improved estimates of near-global ocean heat content and thermal expansion for the upper 300 meters and 700 meters of the ocean for 1950-2003, using statistical techniques that allowed for sparse data coverage and applying recent corrections to reduce systematic biases in the most common ocean temperature observations." And in describing their results, the seven scientists wrote that they "show a slight increase from 1950 to about 1960, a 15-year period to the mid-1970s of zero, or slightly negative trend," and that after the 1976-1977 climate shift, a steady rise to the end of the record," noting that their "ocean warming and thermal expansion trends for 1961-2003 are about 50 percent larger than earlier estimates but about 40 percent smaller for 1993-2003, which is consistent with the recognition that previously estimated rates for the 1990s had a positive bias as a result of instrumental errors." In addition, when they added their observational estimate of upper-ocean thermal expansion to other contributions to sea-level rise (thermal expansion in the deep ocean, the ice sheets of Antarctica and Greenland, glaciers and ice caps, and terrestrial storage), they found that "the sum of contributions from 1961 to 2003 is about 1.5 ± 0.4 mm/year," which they noted is "in good agreement with [their] updated estimate of near-global mean sea-level rise (using techniques established in earlier studies) of 1.6 ± 0.42 mm/year."
Consequently, with respect to James Hansen's claim which he made in testimony to the U.S. House of Representatives on 26 April 2007, i.e., that there is increasing realization that sea level rise this century may be measured in meters if we follow business-as-usual fossil fuel emissions, it would appear that centimeters would have been a much more appropriate choice of units.
The next paper of significance to be published on this subject was that of Wöppelmann et al. (2009), who wrote that "estimates of global-scale sea level rise over the past century are mainly based on long tide gauge records," but who also noted that "the range of estimates published in the literature is rather wide," due to "the methods used to correct the tide gauge records for vertical displacements of the land upon which they are located." And, therefore, they set out to resolve this latter dilemma.
The eight researchers, hailing from France, Spain and the United Kingdom, "analyzed GPS observations from a global network of 227 stations using a consistent processing strategy over the whole period from January 1997 to November 2006," while noting that 160 of the stations they studied "are co-located within 15 km of a tide gauge." And, therefore, assuming that land motion is essentially linear on the time span they considered," the GPS vertical velocities they derived were used "to correct for the land motion affecting the tide gauge records to derive absolute (geocentric) changes in sea level."
When all was accomplished, Wöppelmann et al. were able to report that they obtained a global-average rate of geocentric sea-level rise for the past century, ranging from 1.55 to 1.61 mm/year, depending on whether or not one outlier (of 28 individual regions) was included or omitted from their analysis. The eight researchers were thus able to finally state that their results were "in good agreement with recent estimates," citing the 1.7 mm/year value derived by Church and White (2006) and Holgate (2007), and that they were also "in good agreement with the sum of steric sea level and land ice contributions estimated by Leuliette and Miller (2009) over the recent period of 2003-2007 (1.5 mm/year) using altimetry, Argo, and GRACE gravity observations." Hence, it would appear that 20th-century sea level rise had not been in any way unusual, even over the most recent period of supposedly unprecedented warmth.
Backing up just a bit, it should be noted that in the Fourth Assessment Report of the Intergovernmental Panel on Climate Change, Bindoff et al. (2007) projected a mean global sea level rise somewhere in the range of 18-59 cm relative to mean global sea level in 1990. Subsequently, however, based on statistical models that employed semi-empirical relationships between past and predicted future increases in global temperature, Vermeer and Rahmsdorf (2009), Jevrejeva et al. (2010) and Grinsted et al. (2010) derived much greater increases on the order of 60 to 190 cm over the same time interval. But based on sea level behavior between 1930 and 2010 - as derived from United States tide gauge data, plus extensions of previous global-gauge analyses - a new empirical study, which did not rely on a relationship between sea level and temperature, cast doubt upon both sets of projections.
In this study, Houston and Dean (2011) began their analysis of the subject by noting that global sea level increases of 60-190 cm between 1990 and 2100 would require mean global sea level rate-of-rise accelerations of 0.07-0.28 mm/year/year above the mean global rate-of-rise of the past several decades, which latter rate has typically been calculated to fall somewhere between 1.7 and 1.8 mm/year. Working with the complete monthly-averaged records of 57 U.S. tide gauges archived in the Permanent Service for Mean Sea Level data base that had lengths of 60-156 years (with a mean time span of 82 years), however, they determined that there had not been any acceleration in the rate-of-rise of the sea level along the shorelines of the United States over that period of time, during which interval the world's climate alarmists claim the planet had warmed at a rate and to a level that were unprecedented over the past one to two millennia. Quite to the contrary, in fact, they detected a slight deceleration of -0.0014 mm/year/year. And working with 25 of the tide gauge records that contained data for the period 1930-2010, they calculated an even larger deceleration of -0.0130 mm/year/year.
The two researchers also reported that they "obtained similar decelerations using worldwide-gauge records in the original data set of Church and White (2006) and a 2009 revision (for the periods of 1930-2001 and 1930-2007) and by extending Douglas's (1992) analyses of worldwide gauges by 25 years." Consequently, they rhetorically asked why the concomitant worldwide-temperature increase "has not produced acceleration of global sea level over the past 100 years," and, indeed, "why global sea level has possibly decelerated for at least the last 80 years."
Clearly, the reality of the world is vastly different from what has been portrayed by the IPCC and the world's climate alarmists, based on simulations produced by state-of-the-art climate models. And the empirical facts of this particular "detective case" suggest something much less ominous than what they are predicting for earth's future with regard to the magnitude of sea level change over the remainder of the 21st century.
About this same time, in a review paper published in Oceanography, Pfeffer (2011) provided a 30-year perspective on what scientists had learned about the relationship between land ice and sea level, while at the same time openly acknowledging the weaknesses associated with then-current views of the subject.
The professor - who held positions in both the Institute of Arctic and Alpine Research and the Department of Civil, Environmental and Architectural Engineering of the University of Colorado at Boulder (USA) - began by acknowledging that for all the success of air- and space-borne observations of glaciers and ice sheets, "certain long-standing objectives have consistently eluded researchers," such as obtaining trustworthy observations of glacier basal sliding and calving, as well as an improved understanding of subglacial processes, while further writing that "at present, the foundations of our theoretical knowledge of subglacial sliding and iceberg calving are not very different than what was available at the time of the First IPCC Assessment (Houghton et al., 1990)."
"As was the case nearly three decades ago," as Pfeffer continued, "basal sliding and calving remain obscure but exert critical controls on glacier and ice sheet dynamics," and he noted that as a result, "the lack of detailed observations of basal topography, temperature, and other boundary conditions in critical regions further complicates modeling efforts." In fact, he wrote that the situation was so bleak that researchers "have still not closed the gaps in our knowledge to a degree that 'sliding laws' can be reliably and broadly implemented in numerical models," even adding that "no clear solution to this problem is in sight."
Pfeffer additionally reported that there had been "no comprehensive, global up-scaled compilation of glacier and ice cap loss rates after 2005," stating that "without any proper accounting of the aggregate glacier and ice cap loss rate, the net loss from land ice cannot be reliably calculated." And without such observations, he added that "no reliable assessment of contemporary rates of sea level rise can be made," commenting that "without this knowledge, projections of sea level rise are blind to future contributions from glaciers and ice caps."
In concluding his "weakness" commentary, Pfeffer further stated that our ability to project what glacier and ice discharge will actually be in years and decades to come "is grossly compromised, both by lack of basic inventory knowledge (where are the glaciers and how big are they?) and up-to-date observations of their rate of change." Thus, there is still much important work to be done in the area of land-ice/sea-level interactions before we can have much confidence in what the world's climate alarmists are currently predicting about future sea level rise.
In another study from the same time period, Konikow (2011) wrote that "if the removal of groundwater from storage in the continental subsurface is sufficiently large and persistent, it can represent a substantial transfer of water mass from the land to the oceans, and thereby represent a measureable contributor to long-term sea level rise," citing the supportive studies of Sahagian et al. (1994), Gornitz et al. (1997), Konikow and Kendy (2005), Huntington (2008) and Milly et al. (2010). And, therefore, for the world as a whole between 1900 and 2008, as Konikow described it, he assessed "the magnitude of long-term groundwater depletion by developing the first comprehensive aquifer-based estimate of changes in groundwater storage using direct volumetric accounting," after which he compared the groundwater depletion results he obtained with the results of concomitant sea level rise observations. And what did he thereby learn?
The U.S. Geological Survey researcher reported that groundwater depletion over the period 1900-2008 was about 4,500 km3, which is equivalent to a global sea-level rise of 12.6 mm, or just over 6% of the total observed rise. In addition, he noted that the rate of groundwater depletion has increased markedly since about 1950, with maximum rates occurring during the most recent period (2000-2008), when it averaged ~145 km3/year.
As for sea level rise, Konikow noted that the average rate of rise over the 20th century was 1.7 ± 0.5 mm/year; but he added that the rate may have accelerated in recent years, citing the studies of Church and White (2006), Bindoff et al. (2007) and Lettenmaier and Milly (2009). Over the period 1961-2003, for example, he reported that the average rate of sea level rise was 1.8 ± 0.5 mm/year, as did Church et al. (2011). Over the period 1993-2003, however, Konikow noted that Bindoff et al. (2007) had mean global sea level rising by an estimated rate of 3.1 ± 0.7 mm/year; but Church et al. (2011) indicated that the latter researchers likely overestimated the upper-ocean thermosteric component of the global sea level rise in obtaining such a large result.
All things considered, therefore, Konikow stated that a "better understanding and quantification of the contribution of groundwater depletion to sea-level rise should facilitate an improved understanding of 20th century sea-level rise." And when one looks at the two phenomena side-by-side, one is driven to conclude that the late 20th-early 21st-century increase in groundwater depletion was likely responsible for a good deal of the simultaneous increase in the rate of mean global sea level rise over that period, which conclusion should not be all that surprising, in light of the fact that global temperatures have not experienced much of an increase - if any - over the past decade or so, as has also been noted by Church et al. (2011).
Shortly thereafter, Boretti (2012) began the report of his contribution to the subject by noting that in its report of 2007, the IPCC had projected that global sea level was likely to rise somewhere between 18 and 59 cm by 2100, while noting that certain "model-based analyses performed recently have predicted much higher sea level rise [SLR] for the twenty-first century," even "exceeding 100 cm if greenhouse gas emissions continue to escalate," citing most pointedly in this regard the studies of Rahmstorf (2007, 2010). However, he noted that studies reaching just the opposite conclusion had also been published, referencing those of Holgate (2007), Wunsch et al. (2007), Wenzel and Schroter (2010) and Houston and Dean (2011).
Working with what he called "the best source of global sea level data," however, which he identified as the TOPEX and Jason series of satellite radar altimeter data, Boretti applied simple statistics to the two decades of information they contained in order to "better understand if the SLR is accelerating, stable or decelerating." And what did he thereby learn?
The Australian scientist reported that the average rate of SLR over the almost 20-year period of satellite radar altimeter observations was 3.1640 mm/year, which if held steady over a century would yield a mean global SLR of 31.64 cm, which is just a little above the low-end projection of the IPCC for the year 2100. However, he also found that the rate of SLR had been reducing over the measurement period at a rate of -0.11637 mm/year2, and that this deceleration was also "reducing" at a rate of -0.078792 mm/year3, as may be seen in the following figure from his paper.
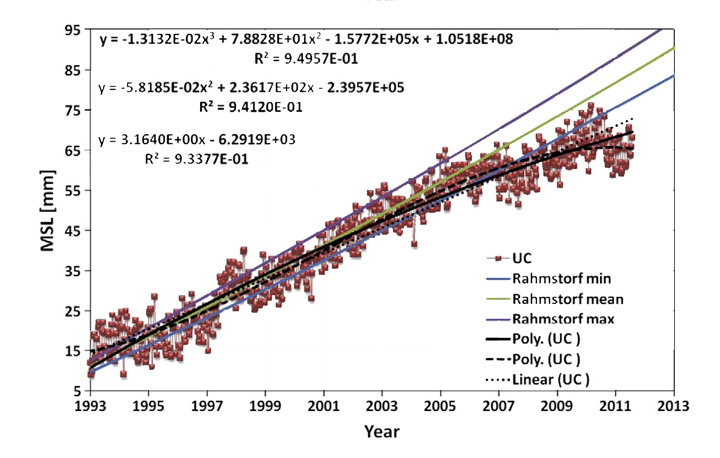
Comparison of Mean Sea Level (MSL) predictions from Rahmstorf (2007) with measurements from the TOPEX and Jason series. Adapted from Boretti (2012), who states in the original figure caption that "the model predictions [of Rahmstorf (2007)] clearly do not agree with the experimental evidence in the short term."
Boretti thus went on to write that the huge deceleration of SLR over the last 10 years "is clearly the opposite of what is being predicted by the models," and that "the SLR's reduction is even more pronounced during the last 5 years." And to illustrate the importance of his findings, he wrote that "in order for the prediction of a 100-cm increase in sea level by 2100 to be correct, the SLR must be almost 11 mm/year every year for the next 89 years," but he noted that "since the SLR is dropping, the predictions become increasingly unlikely," especially in view of the facts that (1) "not once in the past 20 years has the SLR of 11 mm/year ever been achieved," and that (2) "the average SLR of 3.1640 mm/year is only 20% of the SLR needed for the prediction of a one meter rise to be correct."
Clearly, therefore, the more-rabid-than-even-the-IPCC crowd has it all wrong when it comes to both sea level and climate, for as Boretti concluded, "the oceans are truly the best indicator of climate," and what they suggest is not compatible with what those alarmed about climate change continually claim.
In a concurrent study, Chambers et al. (2012) wrote that "numerous papers have commented on the appearance of decadal and longer period fluctuations in select tide gauge records (e.g., Feng et al., 2004; Miller and Douglas, 2007; Woodworth et al., 2009; Sturges and Douglas, 2011)," commenting that "multi-decadal fluctuations also appear in reconstructions of global mean sea level (GMSL) that are computed from tide gauge records, using quite different techniques (Holgate, 2007; Jevrejeva et al., 2008; Merrifield et al., 2009; Wenzel and Schroter, 2010; Church and White, 2011; Ray and Douglas, 2011)." And in their own study of long tide gauge records in every ocean basin, Chambers et al. found that there was, indeed, "a significant oscillation with a period around 60-years in the majority of the tide gauges examined during the 20th century." And why was this finding so important?
First of all, the three researchers noted that "an upturn in GMSL rise due to a 60-year oscillation with a minimum between 1980 and 1990 is consistent with the increased GMSL trend obtained from satellite altimetry (e.g., Nerem et al., 2010) and reconstructions since 1993." But this fact, as they continued, "does not change the overall conclusion that sea level has been rising on average by 1.7 mm/year over the last 110 years." And, therefore, they concluded that "although several studies have suggested the recent change in trends of global (e.g., Merrifield et al., 2009) or regional (e.g., Sallenger et al., 2012) sea level rise reflects an acceleration, this must be re-examined in light of a possible 60-year oscillation," in further support of which contention they noted that "there have been previous periods where the rate was decelerating, and rates along the Northeast U.S. coast have what appears to be a 60-year-period (Sallenger et al., 2012)," which they also indicated "is consistent with our observations of sea level variability at New York City and Baltimore."
As a final bit of advice in light of the results of their analysis, therefore, Chambers et al. prudently stated that "one should be cautious about computations of acceleration in sea level records unless they are longer than two cycles of the oscillation," noting that this advice "applies to interpretation of acceleration in GMSL using only the 20-year record of satellite altimetry and to evaluations of short records of mean sea level from individual gauges."
Shortly thereafter, in introducing their study of the subject, Baur et al. (2013) wrote that "present-day continental mass variation as observed by space gravimetry reveals secular mass decline and accumulation," further noting that "whereas the former contributes to sea-level rise, the latter results in sea-level fall." And, therefore, they indicated that "consideration of mass accumulation (rather than focusing solely on mass loss) is important for reliable overall estimates of sea-level change."
Heeding their own advice, and employing data derived from the Gravity Recovery And Climate Experiment - i.e., the GRACE satellite mission - Baur et al. assessed continental mass variations on a global scale, including both land-ice and land-water contributions, for 19 continental areas that exhibited significant signals. This they did for a period of nine years (2002-2011), which they made a point of noting included "an additional 1-3 years of time-variable gravity fields over previous studies." And to compensate for the impact of this glacial isostatic adjustment (GIA), they applied the GIA model of Paulson et al. (2007). And what did they thereby learn?
Over the nine years of their study, the three researchers reported that the mean GIA-adjusted mass gain and mass loss in the 19 areas of their primary focus amounted to - (0.7 ± 0.4 mm/year) of sea-level fall and + (1.8 ± 0.6) mm/year of sea-level rise, for a net effect of + (1.1 ± 0.6) mm/year. Then, to obtain a figure for total sea-level change, they added the steric component of + (0.5 ± 0.5) mm/year - which was derived by Leuliette and Willis (2011) - to their net result to obtain a final (geocenter neglected) result of + (1.6 ± 0.8) mm/year and a final (geocenter corrected) result of + (1.7 ± 0.8) mm/year.
This final geocenter-corrected result of Baur et al. is most heartening, as Chambers et al. (2012) had indicated that "sea level has been rising on average by 1.7 mm/year over the last 110 years," as had also been suggested by the analyses of Church and White (2006) and Holgate (2007). In addition, the air's CO2 concentration is known to have risen by close to a third. And, still, it has not impacted the rate-of-rise of global sea level.
In another study from the same year, Jevrejeva et al. (2014) wrote that "satellite altimetry measurements since 1993 have provided unique information about changes in global and regional mean sea levels," suggesting a mean rate of rise of 3.2 mm/yr for global sea level over the period 1993-2012, as per the findings of Boening et al. (2012) and Cazenave et al. (2012), which result, as they described it, "notably exceeds the estimate of 1.8 mm/yr sea level rise for the 20th century," as per the finding of Bindoff et al. (2007). So which rate is closest to the truth?
In answering this important question, Jevrejeva et al. (2014) described how they renewed the global sea level [GSL] reconstruction of Jevrejeva et al. (2006) by "using monthly mean sea level data collected by the Permanent Service for Mean Sea Level (PSMSL) covering the observations from 1807 to 2010," thereby improving the GSL reconstruction by increasing data coverage "by using many more stations, particularly in the polar regions, and recently processed historic data series from isolated island stations," as well as by extending the termination of the reconstruction from 2002 to 2009.
As for what they learned by so doing, the five researchers wrote that their new reconstruction "suggests a linear trend of 1.9 ± 0.3 mm/yr during the 20th century" and "1.8 ± 0.5 mm/yr for the period 1970-2008." And, therefore, although some regions had recently experienced much greater rates of sea level rise - such as the Arctic (3.6 mm/yr) and Antarctic (4.1 mm/yr), with the mid-1980s even exhibiting a rate of 5.3 mm/yr (Holgate, 2007) - this newest analysis of the most comprehensive data set available suggested that there had been no dramatic increase (or any increase, for that matter) in the mean rate of global sea level rise due to the historical increase in the atmosphere's CO2 concentration.
In one final study, and as a preface to describing their new approach to the subject, Wöppelmann et al. (2014) wrote that "whichever data analysis strategy is employed, the evidence for sea level rise primarily comes from the information provided by long tide gauge records," which "are mainly located along the coasts of northeast America or western Europe." And given this uneven distribution, they have indicated that "information on long-term spatial variability is limited," citing Woodworth (2006), while additionally noting that "in the majority of studies the tide gauge records have only been corrected for the vertical land motion associated with the glacial isostatic adjustment (GIA)," citing Peltier (2004). And irrespective of the accuracy of the GIA models involved, they stated that "other geophysical processes can cause vertical displacements of the land upon which the tide gauges are grounded," citing as examples the facts that (1) "delta regions are prone to subsidence processes, which are often caused by sediment compaction and removal of underground water," as noted by Kolker et al. (2011) and Wöppelmann et al. (2013), and that (2) "tectonically active areas are likely to display abrupt vertical land movements," citing Ballu et al. (2011).
The way in which the six European researchers overcame this latter problem was to accurately determine the vertical motion of the land upon which each of the tide gauges employed in their study was located. This they did, based on data they obtained from the Global Positioning System (GPS) that the University of La Rochelle consortium (Santamaria-Gomez et al., 2012) used to produce the final gauge-site vertical velocities. And what did their results reveal?
Wöppelmann et al. (2014) reported that their work revealed the existence of "a clearly distinct behavior between the Northern and the Southern Hemispheres," with mean sea level rates of rise of 2.0 mm/year and 1.1 mm/year, respectively. And, therefore, given the coherent spatial patterns they observed, they went on to say that a mean global sea level rate-of-rise value of 1.5 ± 0.5 mm/year was inferred from "a weighted average of the hemispheric trends according to the area they represent." And so it was that they wrote in conclusion that these findings "challenge the widely accepted value of global sea level rise for the twentieth century."
So as things stand currently, it would appear that real-world sea level rise has been far less dramatic over the course of the Industrial Revolution than what has typically been claimed to be the case by the world's climate alarmists.
References
Antonov, J.I., Levitus, S. and Boyer, T.P. 2005. Themosteric sea level rise: 1955-2003. Geophysical Research Letters 32: 10.1029/2005GL023112.
Baur, O., Kuhn, M. and Featherstone, W.E. 2013. Continental mass change from GRACE over 2002-2011 and its impact on sea level. Journal of Geodesy 87: 117-125.
Bindoff, N.L., Willebrand, J., Artale, V., Cazenave, A., Gregory, J., Gulev, S., Hanawa, K., Le Quere, C., Levitus, S., Nojiri, Y., Shum, C.K., Talley, L.D. and Unnikrishnan, A. 2007. Observations: Oceanic climate change and sea level. In: Solomon, S., Qin, D., Manning, M., Chen, Z., Marquis, M., Averyt, K.B., Tignor, M. and Miller, H.L. (Eds.). Climate Change 2007: They Physical Science Basis. Contribution of Working Group I to the Fourth Assessment Report of the Intergovernmental Panel on Climate Change. Cambridge University Press, Cambridge, United Kingdom.
Boening, C., Willis, J.K., Landerer, F.W., Nerem, R.S. and Fasullo, J. 2012. The 2011 La Niña: So strong, the oceans fell. Geophysical Research Letters 39: 10.1029/2012GL053055.
Boretti, A.A. 2012. Short term comparison of climate model predictions and satellite altimeter measurements of sea levels. Coastal Engineering 60: 319-322.
Carton, J.A., Giese, B.S. and Grodsky, S.A. 2005. Sea level rise and the warming of the oceans in the Simple Ocean Data Assimilation (SODA) ocean reanalysis. Journal of Geophysical Research 110: 10.1029/2004JC002817.
Cazenave, A., Cabanes, C., Dominh, K., Gennero, M.C. and Le Provost, C. 2003. Present-day sea level change: observations and causes. Space Science Reviews 108: 131-144.
Cazenave, A. Henry, O., Munier, S., Meyssignac, B., Delcroix, T., Llovel, W., Palanisamy, H. and Becker, M. 2012. Estimating ENSO influence on the global mean sea level, 1993-2010. Marine Geodesy 35: 82-97.
Cazenave, A. and Nerem, R.S. 2004. Present-day sea level change: observations and causes. Reviews of Geophysics 42: 10.1029/2003RG000139.
Chambers, D.P, Merrifield, M.A. and Nerem, R.S. 2012. Is there a 60-year oscillation in global mean sea level? Geophysical Research Letters 39: 10.1029/2012GL052885.
Church, J.A. and White, N.J. 2006. A 20th century acceleration in global sea-level rise. Geophysical Research Letters 33: 10.1029/2005GL024826.
Church, J.A. and White, N.J. 2011. Sea-level rise from the late 19th to the early 21st century. Surveys in Geophysics 32: 585-602.
Church, J.A., White, N.J., Coleman, R., Lambeck, K. and Mitrovica, J.X. 2004. Estimates of the regional distribution of sea level rise over the 1950-2000 period. Journal of Climate 17: 2609-2625.
Church, J.A., White, N.J., Konikow, L.F., Domingues, C.M., Cogley, J.G., Rignot, E., Gregory, J.M., van den Broeke, M.R., Monaghan, A.J. and Velicogna, I. 2011. Revisiting the earth's sea-level and energy budgets from 1961 to 2008. Geophysical Research Letters 38: 10.1029/2011GL048794.
Domingues, C.M., Church, J.A., White, N.J., Gleckler, P.J., Wijffels, S.E., Barker, P.M. and Dunn, J.R. 2008. Improved estimates of upper-ocean warming and multi-decadal sea-level rise. Nature 453: 1090-1093.
Douglas, B.C. 1991. Global sea level rise. Journal of Geophysical Research 96: 6981-6992.
Douglas, B.C. 1992. Global sea level acceleration. Journal of Geophysical Research 97: 12,699-12,706.
Douglas, B.C. 1997. Global sea level rise: a redetermination. Surveys of Geophysical Research 18: 279-292.
Douglas, B.C. 2001. Sea level change in the era of the recording tide gauge. In: Douglas, B., Kearney, M. and Leatherman, S. (Eds.), Sea Level Rise: History and Consequences, Academic Press, San Diego, CA, USA, pp. 37-64.
Feng, M., Li, Y. and Meyers, G. 2004. Multidecadal variations of Fremantle sea level: Footprint of climate variability in the tropical Pacific. Geophysical Research Letters 31: 10.1029/2004GL019947.
Gornitz, V., Rosenzweig, C. and Hillel, D. 1997. Effects of anthropogenic intervention in the land hydrologic cycle on global sea level rise. Global and Planetary Change 14: 147-161.
Grinsted, A., Moore, J.C. and Jevrejeva, S. 2010. Reconstructing sea level from paleo and projected temperatures 200 to 2100 AD. Climate Dynamics 34: 461-472.
Holgate, S.J. 2007. On the decadal rates of sea level change during the twentieth century. Geophysical Research Letters 34: 10.1029/2006GL028492.
Holgate, S.J. and Woodworth, P.L. 2004. Evidence for enhanced coastal sea level rise during the 1990s. Geophysical Research Letters 31: 10.1029/2004GL019626.
Houghton, J.T., Jenkins, G.J. and Ephraums, J.J. (Eds.). 1990. Climate Change: The IPCC Scientific Assessment. Cambridge University Press, Cambridge, UK.
Houston, J.R. and Dean, R.G. 2011. Sea-level acceleration based on U.S. tide gauges and extensions of previous global-gauge analyses. Journal of Coastal Research 27: 409-417.
Huntington, T.G. 2008. Can we dismiss the effect of changes in land-based water storage on sea-level rise? Hydrological Processes 22: 717-723.
Ishii, M., Kimoto, M. and Kachi, M. 2003. Historical ocean subsurface temperature analysis with error estimates. Monthly Weather Review 131: 51-73.
Jevrejeva, S., Grinsted, A., Moore, J.C. and Holgate, S. 2006. Nonlinear trends and multiyear cycles in sea level records. Journal of Geophysical Research 111: 10.1029/2005JC003229.
Jevrejeva, S., Moore, J.C. and Grinsted, A. 2010. How will sea level respond to changes in natural and anthropogenic forcings by 2100? Geophysical Research Letters 37: 10.1029/2010GL042947.
Jevrejeva, S., Moore, J.C., Grinsted, A., Matthews, A.P. and Spada, G. 2014. Trends and acceleration in global and regional sea levels since 1807. Global and Planetary Change 113: 11-22.
Jevrejeva, S., Moore, J.C., Grinsted, A. and Woodworth, P.L. 2008. Recent global sea level acceleration started over 200 years ago? Geophysical Research Letters 35: 10.1029/2008GL033611.
Konikow, L.F. 2011. Contribution of global groundwater depletion since 1900 to sea-level rise. Geophysical Research Letters 38: 10.1029/2011GL048604.
Konikow, L.F. and Kendy, E. 2005. Groundwater depletion: A global problem. Hydrogeology Journal 13: 317-320.
Leuliette, E.W. and Miller, L. 2009. Closing the sea level rise budget with altimetry, Argo, and GRACE. Geophysical Research Letters 36: 10.1029/2008GL036010.
Levitus, S., Antonov, J.I., Boyer, T.P., Garcia, H.E. and Locarnini, R.A. 2005. EOF analysis of upper ocean heat content, 1956-2003. Geophysical Research Letters 32: 10.1029/2005GL023606/.
Levitus, S., Antonov, J.I., Boyer, T.P. and Stephens, C. 2000. Warming of the world ocean. Science 287: 2225-2229.
Lombard, A., Cazenave, A., Le Traon, P.-Y. and Ishii, M. 2005. Contribution of thermal expansion to present-day sea-level change revisited. Global and Planetary Change 47: 1-16.
Maul, G.A. and Martin, D.M. 1993. Sea level rise at Key West, Florida, 1846-1992: America's longest instrument record? Geophysical Research Letters 20: 1955-1958.
Merrifield, M.A., Merrifield, S.T. and Mitchum, G.T. 2009. An anomalous recent acceleration of global sea level rise. Journal of Climate 22: 5772-5781.
Miller, L. and Douglas, B.C. 2007. Gyre-scale atmospheric pressure variations and their relation to 19th and 20th century sea level rise. Geophysical Research Letters 34: 10.1029/2007GL030862.
Milly, P.C.D., Cazenave, A., Famiglietti, J.S., Gornitz, V., Laval, K., Lettenmaier, D.P., Sahagian, D.L., Wahr, J.M. and Wilson, C.R. 2010. Terrestrial water-shortage contributions to sea-level rise and variability. In: Church, J.A., Woodworth, P.L., Aarup, T. and Wilson, W.S. (Eds.) Understanding Sea-Level Rise and Variability. Wiley-Blackwell, Oxford, United Kingdom, pp. 226-255.
Mitrovica, J.X., Wahr, J., Matsuyama, I., Paulson, A. and Tamisea, M.E. 2006. Reanalysis of ancient eclipse, astronomic and geodetic data: a possible route to resolving the enigma of global sea-level rise. Earth and Planetary Science Letters 243: 390-399.
Morner, N.-A. 1973. Eustatic changes during the last 300 years. Palaeogeography, Palaeoclimatology, Palaeoecology 9: 153-181.
Morner, N.-A. 2000. Sea level changes along Western Europe. In: Integrated Coastal Zone Management, 2nd ed. IPC Publ., London-Hong Kong, pp. 33-37.
Morner, N.-A. 2004. Estimating future sea level changes from past records. Global and Planetary Change 40: 49-54.
Munk, W. 2002. Twentieth century sea level: an enigma. Proceedings of the National Academy of Science, USA 99: 6550-6555.
Nerem, R.S., Chambers, D.P., Choe, C. and Mitchum, G.T. 2010. Estimating mean sea level change from the TOPEX and Jason altimeter missions. Marine Geodesy 33, Supplement 1: 435-446.
Nerem, R.S. and Mitchum, G.T. 2001. Sea level change. In: Fu, L.L. and Cazenave, A. Eds. Satellite Altimetry and Earth Sciences: A Handbook of Techniques and Applications. Academic Press, San Diego, CA, pp. 329-349.
Paulson, A., Zhong, S. and Wahr, J. 2007. Inference of mantle viscosity from GRACE and relative sea level data. Geophysical Journal International 171: 497-508.
Peltier, W.R. 2001. Global glacial isostatic adjustment and modern instrumental records of relative se3a level history. In: Douglas, B., Kearney, M. and Leatherman, S. (Eds.), Sea Level Rise: History and Consequences, Academic Press, San Diego, CA, USA, pp. 65-95.
Pfeffer, W.T. 2011. Land ice and sea level rise: A thirty-year perspective. Oceanography 24: 94-111.
Pirazzoli, P.A., Grant, D.R. and Woodworth, P. 1989. Trends of relative sea-level changes: past, present, future. Quaternary International 2: 63-71.
Rahmstorf, S. 2007. A semi-empirical approach to projecting future sea-level rise. Science 315: 368-370.
Rahmstorf, S. 2010. A new view on sea level rise: has the IPCC underestimated the risk of sea level rise. Nature Reports Climate Change: 10.1038/climate.2010.29.
Ray, R.D. and Douglas, B.C. 2011. Experiments n reconstructing twentieth-century sea levels. Progress in Oceanography 91: 496-515.
Sahagian, D.L., Schwartz, F.W. and Jacobs, D.K. 1994. Direct anthropogenic contributions to sea level rise in the twentieth century. Nature 367: 54-57.
Sallenger, A.H., Doran, K.S. and Howd, P.A. 2012. Hotspot of accelerated sea level rise on the Atlantic coast of North America. Nature Climate Change: 10.1038/NCLIMATE1597.
Sturges, W. and Douglas, B.C. 2011. Wind effects on estimates of sea level rise. Journal of Geophysical Research 116: 10.1029/2010JC006492.
Vermeer, M. and Rahmsdorf, S. 2009. Global sea level linked to global temperature. Proceedings of the National Academy of Sciences USA 106: 21,527-21,532.
Volkov, D.L. and van Aken, H.M. 2005. Climate-related change of sea level in the extratropical North Atlantic and North Pacific in 1993-2003. Geophysical Research Letters 32: 10.1029/2005GL023097.
Wenzel, M. and Schroter, J. 2010. Reconstruction of regional mean sea level anomalies from tide gauges using neural networks. Journal of Geophysical Research 115: 10.1029/2009JC005630.
White, N.J., Church, J.A. and Gregory, J.M. 2005. Coastal and global averaged sea level rise for 1950 to 2000. Geophysical Research Letters 32: 10.1029/2004GL021391.
Woodworth, P.L. 1990. A search for accelerations in records of European mean sea level. International Journal of Climatology 10: 129-143.
Woodworth, P.L., White, N.J., Jevrejeva, S., Holgate, S.J., Church, J.A. and Gehrels, W.R. 2009. Evidence for the accelerations of sea level on multi-decade and century timescales. International Journal of Climatology 29: 777-789.
Wöppelmann, G., Le Cozannet, G., de Michele, M., Raucoules, D., Cazenave, A., Garcin, M., Hanson, S., Marcos, M. and Santamaria-Gomez, A. 2013. Is land subsidence increasing the exposure to sea level rise in Alexandria, Egypt? Geophysical Research Letters 40: 1-5.
Wöppelmann, G., Letetrel, C., Santamaria, A., Bouin, M.-N., Collilieux, X., Altamimi, Z., Williams, S.D.P. and Miguez, B.M. 2009. Rates of sea-level change over the past century in a geocentric reference frame. Geophysical Research Letters 36: 10.1029/2009GL038720.
Wöppelmann, G., Marcos, M., Santamaria-Gomez, A., Martin-Miguez, B., Bouin, M.-N. and Gravelle, M. 2014. Evidence for a differential sea level rise between hemispheres over the twentieth century. Geophysical Research Letters 41: 1639-1643.
Wöppelmann, G., Miguez, B.M., Bouin, M.-N. and Altamimi, Z. 2007. Geocentric sea-level trend estimates from GPS analyses at relevant tide gauges world-wide. Global and Planetary Change 57: 396-406.
Wunsch, C., Ponte, R.M. and Heimbach, P. 2007. Decadal trends in sea level patterns: 1993-2004. Journal of Climate 20: 5889-5911.
Last updated 29 July 2015