Volume 9, Number 42: 18 October 2006
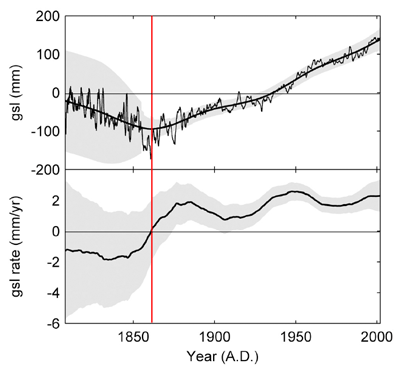
In a revealing new study of globally-distributed sea level time series, Jevrejeva et al. (2006) analyzed information contained in the Permanent Service for Mean Sea Level database using a method based on Monte Carlo Singular Spectrum Analysis, removing 2- to 30-year quasi-periodic oscillations and determining nonlinear long-term trends for 12 large ocean regions, which they combined to produce the mean global sea level (gsl) and mean global sea level rate-of-rise (gsl rate) curves depicted in the figure below.
Mean gsl (top), with its shaded 95% confidence interval, and mean gsl rate (bottom), with its shaded standard error interval, adapted from Jevrejeva et al. (2006).
With respect to the results of their analysis, Jevrejeva et al. say their findings show that "global sea level rise is irregular and varies greatly over time," noting that "it is apparent that rates in the 1920-1945 period are likely to be as large as today's." In addition, they report that their "global sea level trend estimate of 2.4 +/- 1.0 mm/yr for the period from 1993 to 2000 matches the 2.6 +/- 0.7 mm/yr sea level rise found from TOPEX/Poseidon altimeter data."
With respect to what Jevrejeva et al. describe as "the discussion on whether sea level rise is accelerating," their results pretty much answer the question in the negative; and in further support of this conclusion, they note that "Church et al. (2004) pointed out that with decadal variability in the computed global mean sea level, it is not possible to detect a significant increase in the rate of sea level rise over the period 1950-2000," as is clearly evident from the bottom portion of the above figure.
These observations make us wonder why late 20th-century global warming - which climate alarmists describe as having been unprecedented over the past two millennia - cannot be detected in global sea level data. We are even more intrigued about the matter in light of the fact that the warming that initiated the demise of the Little Ice Age - which by climate-alarmist contention should have been considerably less dramatic than the warming of the late 20th century - is readily apparent in the central third of the above figure. Likewise, we are perplexed by the empirical fact that the rising atmospheric CO2 concentration - which climate alarmists claim is primarily responsible for the supposedly unprecedented global warming of the late 20th century - experienced a dramatic increase in its rate of rise just after 1950 (shifting from a 1900-1950 mean rate-of-rise of 0.33 ppm/yr to a 1950-2000 mean rate-of-rise of 1.17 ppm/yr), yet the rate of mean global sea level rise did not trend upwards after 1950, nor has it subsequently exceeded its 1950 rate-of-rise.
Clearly, either something is drastically wrong with climate-alarmist theory, or something is drastically wrong with the pertinent real-world data. Although many people choose to believe the theory over the data - or they promote the theory in spite of believing the data (or they simply ignore the data) for philosophical or political reasons - we find it much more compelling - and satisfying - to both believe the data and act in harmony with that belief.
So we ask you what we ask ourselves almost every day: what do you believe? ... why do you believe it? ... and how do you act in light of that belief?
Sherwood, Keith and Craig Idso
References
Church, J.A., White, N.J., Coleman, R., Lambert, K. and Mitrovica, J.X. 2004. Estimates of the regional distribution of sea level rise over the 1950-2000 period. Journal of Climate 17: 2609-2625.
Jevrejeva, S., Grinsted, A., Moore, J.C. and Holgate, S. 2006. Nonlinear trends and multiyear cycles in sea level records. Journal of Geophysical Research 111: 10.1029/2005JC003229.


