Real-Time Results
Real-Time Results: Week 5
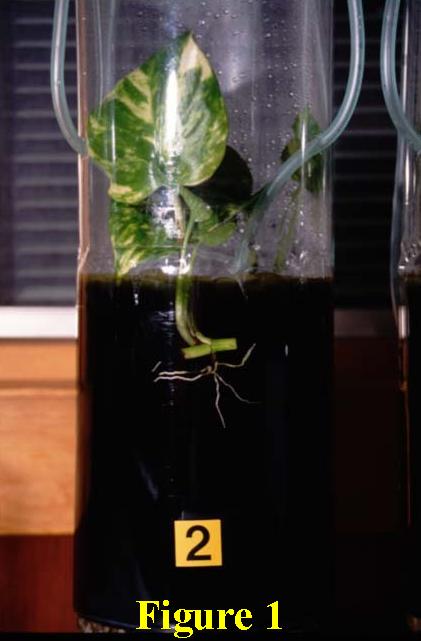
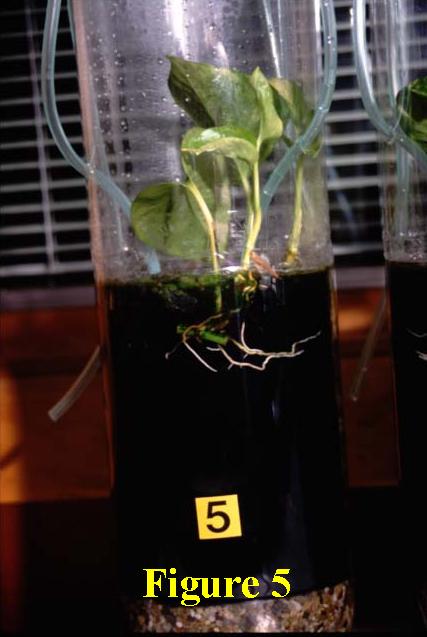
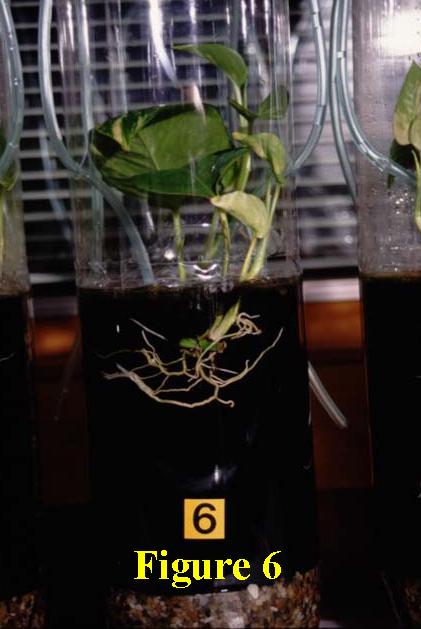
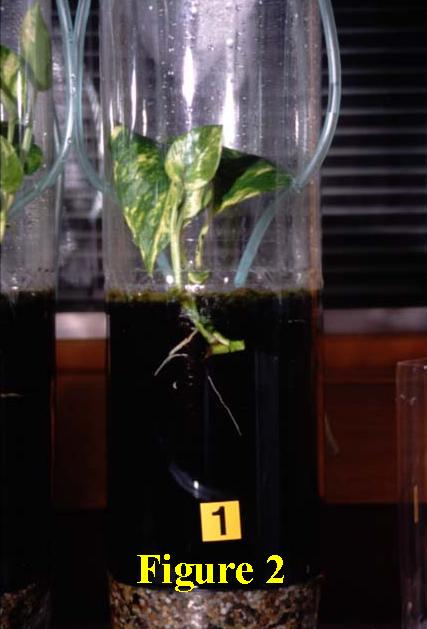 Instead of graphs this week, we are displaying individual photos of each bottle biosphere. The only bottles out of sequence, in terms of airspace CO2 concentration, are Bottles 1 and 2. Bottle 2 has a mean airspace CO2 concentration of 263 ppm, while Bottle 1 has a CO2 content of 273 ppm. Then come Bottles 3, 4, 5 and 6, with mean experiment-to-date CO2 concentrations of 621, 658, 919 and 1141 ppm.
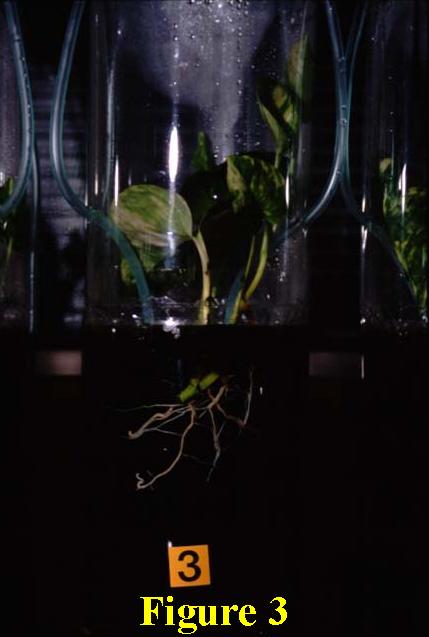
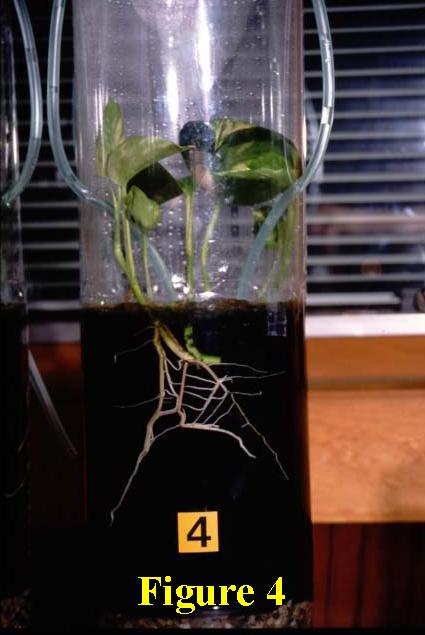 As can be seen from the six figures, the viewable plant of Bottle 5 still appears to be anomalous in terms of its secondary root system. In terms of its new vine development and primary root system, however, it is comparable to the plants of Bottles 3, 4 and 6. The figures also reveal the development of leaves on the new vines of the plants.