


Final Results
 Harvesting procedures and data analysis for Experiment #2 were analogous to those of Experiment #1 and, hence, will not be repeated here, the only difference being that we could easily dump all of the gravel out of each of the 3-liter bottle biosphere bases of this second study and more readily extract the plants.
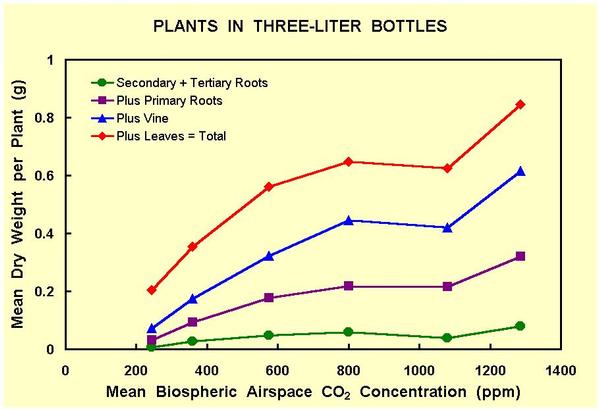
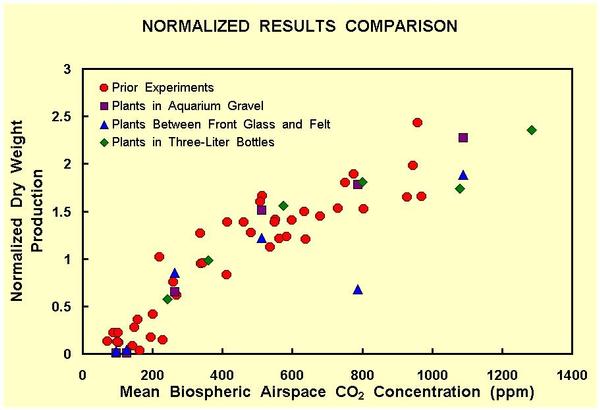 Figure 1 depicts the final dry weight results we obtained by averaging the data obtained for the one bulk gravel plant and the single black felt plant in each bottle biosphere.
 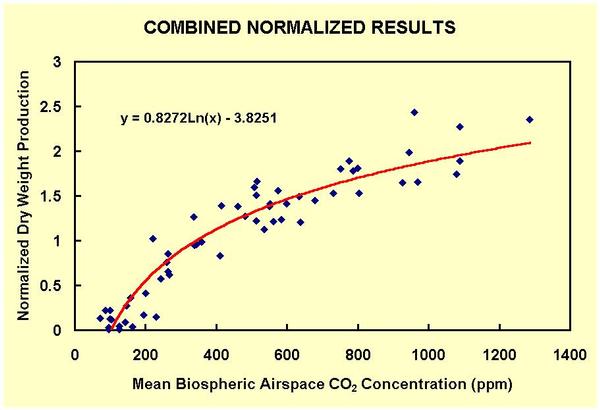 These results, in normalized format, are depicted in Figures 13 and 14 of Experiment #1 (shown here as well). Once again, it was gratifying that, when the final harvest was completed, the effects of the various degrees of atmospheric CO2 enrichment were clearly evident and compatible with the mass of results described in the Final Results section of Experiment #1.