


Real-Time Results
Real-Time Results: Week 1
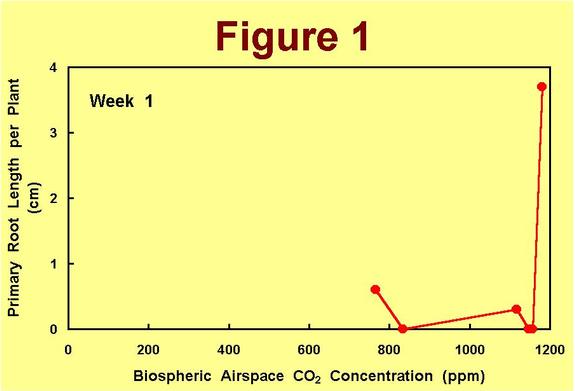 The plants of Experiment 2 appear to be getting off to a faster start than those of Experiment 1 did. As shown in Figure 1, primary root growth is evident in three of the six bottle biospheres (it was only evident in one tank in Experiment 1 at this stage); and as depicted in Figure 2, all of the biospheres show evidence of new vine growth (which didn't begin until Week 2 in Experiment 1).
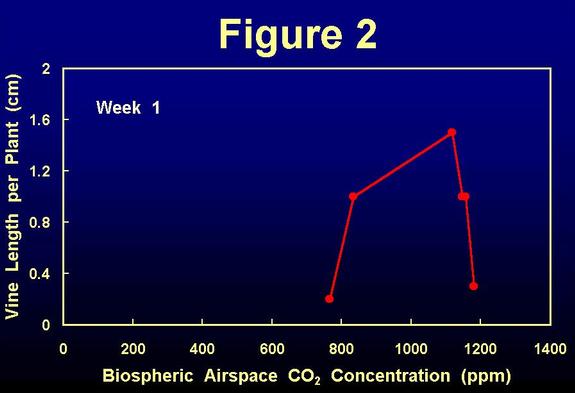 Mean airspace CO2 concentrations were all fairly high during this first week of the study, ranging from 767 to 1181 ppm, which may have been partially responsible for the rapid initial growth of the plants in this experiment. In Experiment 1, by comparison, the first week's mean CO2 concentrations ranged from 438 to 1109 ppm. Another possible explanation for the initial rapid growth of the plants in this study may be that they obtain some advantage from the natural light they receive from the window by which they are placed.