Real-Time Results
Real-Time Results: Week 5
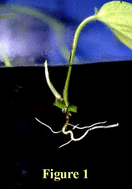
 At the conclusion of Week 5, three of the original seven Pothos leaves in each of the low CO2 tanks (1 and 2) are dead, while a fourth leaf in each tank is in the process of dying. At the other end of the spectrum, however, more positive events are occurring, as some of the new vine sprouts are beginning to emerge above the surface of the aquarium gravel (see Figure 1 for an example from Tank 6). Four such sprouts have appeared in Tanks 5 and 6, three in Tank 3, and two in Tanks 2 and 4.
  Figure 2 displays the mean new-vine length per plant (measured, at this stage, as the distance from its juncture with the original vine to its growing tip) for the two front plants of each tank as a function of the mean experiment-to-date airspace CO2 concentration.

 Figures 3 and 4 depict the current states of primary and secondary root development in the six biospheres. Both graphs reveal a trend towards more root length per plant with increasing CO2; but there is still a lot of scatter in the primary root data.


