Real-Time Results
Real-Time Results: Week 3
 Figure 1 depicts the results of our root growth measurements at the end of Week 3. The results for Tank 3, at approximately 400 ppm CO2, seem unusually high compared to the other data. One possible cause of this apparent anomaly is the natural variability that exists among different individual plants . The two plants located at the front of Tank 3, for example, may just be naturally more robust than those of the other tanks.
  Another source of variability could be the way the original leaf stems were situated between the aquarium glass and the black felt material. These and other unknown sources of variability are the reasons we put five additional plants in each tank and placed them in the aquarium gravel behind the black felt material.
  In this position they can grow in a more natural environment, where their roots are free to explore a three-dimensional matrix shielded from the direct glare of the aquarium lights.
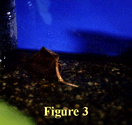
 In this third week of the study, some of the original parent leaves in the low-CO2 environments of Tanks 1 and 2 began to turn yellow and brown (see Figure 2), with one in each tank actually dying completely (see Figure 3). The new vine sprouts, however, continued to grow, essentially doubling their lengths since the end of last week in all of the tanks (see Figure 4).


