


Results and Conclusions
In what follows, we present several graphics that help one better discern the major message and sub-messages of the data contained in our Ocean Acidification Database. These figures will be updated periodically, as the number of records in the database grows and as time permits us to redo the various analyses upon which the figures are based.
We begin by plotting in Figure 1 the percent changes in all five of the major life characteristics included in this study (calcification, metabolism, growth, fertility and survival) as functions of experimentally-orchestrated declines in seawater pH from the presently prevailing value, where each entry in our Ocean Acidification Database is represented by its own individual data point.
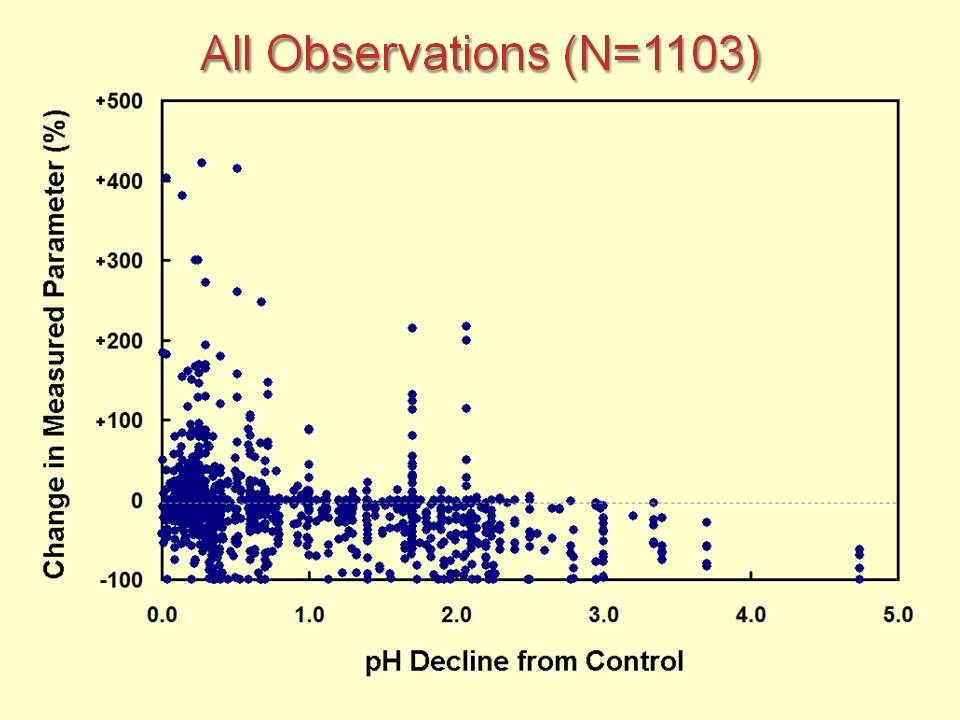
As may be seen from this figure, it portrays an extremely wide range of pH reduction values, the greatest of which corresponds to an increase in the atmosphere's CO2 concentration in excess of 100,000 ppm, which is a couple orders of magnitude greater than what anyone is expecting will ever occur. Hence, in what follows in Figure 2, we have highlighted (in grey) the vast bulk of this pH reduction range as being "far, far beyond the realm of reality."
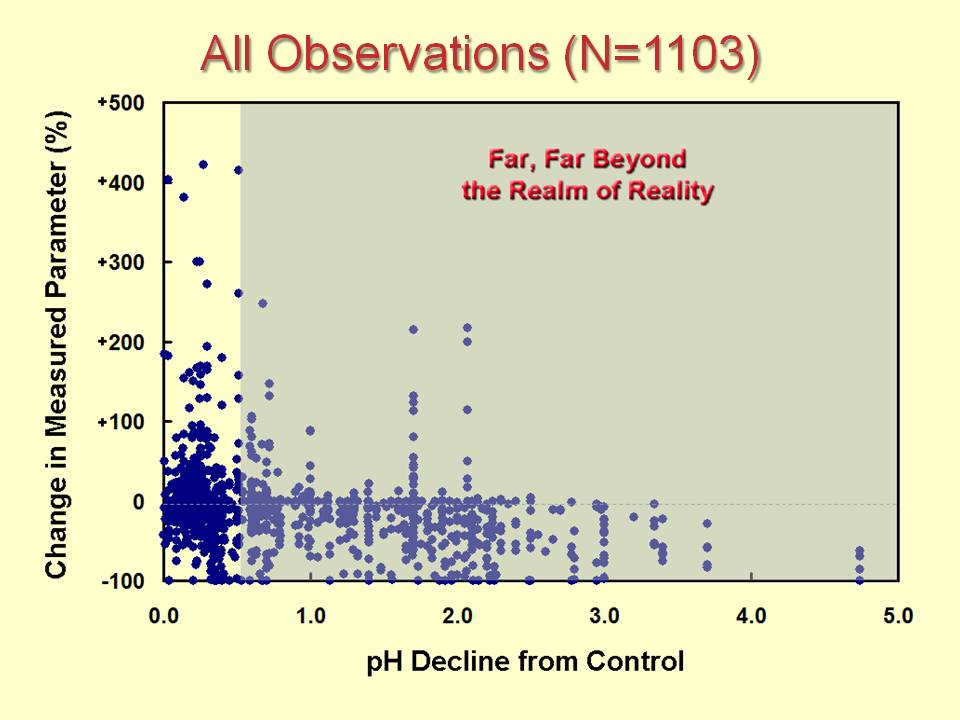
Figure 2. Same as Figure 1, but highlighting the vast pH reduction region that is "far, far beyond the realm of reality" in terms of it ever occurring in the real world.
In the next figure, we plot the results of all experiments that employed a seawater pH decline that fell somewhere in the still-more-likely-to-occur range of 0.0 to 0.3, where the latter value is the approximate IPCC-derived pH decline in the vicinity of AD 2100. Then, within this range, we highlight (in grey) the much smaller seawater pH reduction range that derives from the work of Tans (2009), who derived a maximum pH decline that could fall anywhere within an uncertainty range of 0.09 to 0.17 by about AD 2100, after which seawater pH begins its long-term recovery. We do this because we consider the analysis of Tans to be more realistic than the analysis of the IPCC. Thus, we would consider data within the pH reduction range of 0.0 to 0.17 as being most characteristic of what might possibly occur in the real world, as time marches on and fossil fuel burning continues as per business as usual. And, interestingly enough -- and even incorporating pH reduction data all the way out to 0.30 -- the linear trend of all the data is actually positive, indicating an overall beneficial response of the totality of the five major life characteristics of marine sea life to ocean acidification, which result is vastly different from the negative results routinely predicted by the world's climate alarmists.
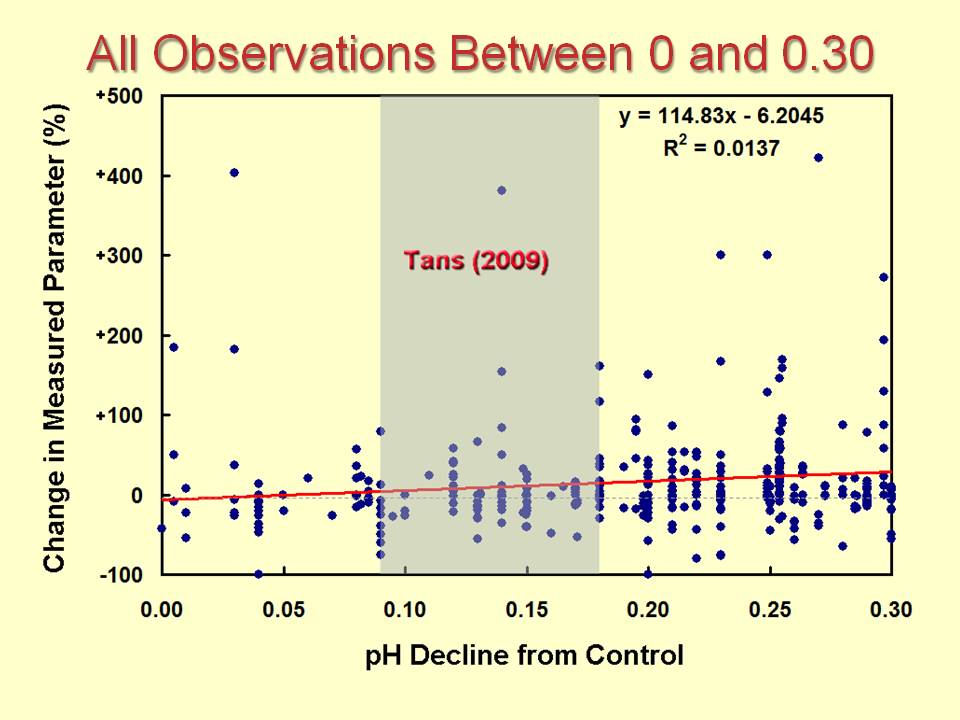
Figure 3. Percent changes in the five measured life characteristics (calcification, metabolism, growth, fertility and survival) from its present (control treatment) value over the pH decline range of 0 to 0.3.
In the next set of graphs, we examine the database we have assembled by life characteristic category (beginning with calcification), depicting in Figure 3 the distribution of all calcification data points; while in Figure 4 we display the distribution of the mean calcification data points for the five seawater pH reduction intervals/categories defined by the figure displayed and described in our Description of the Ocean Acidification Database Tables.
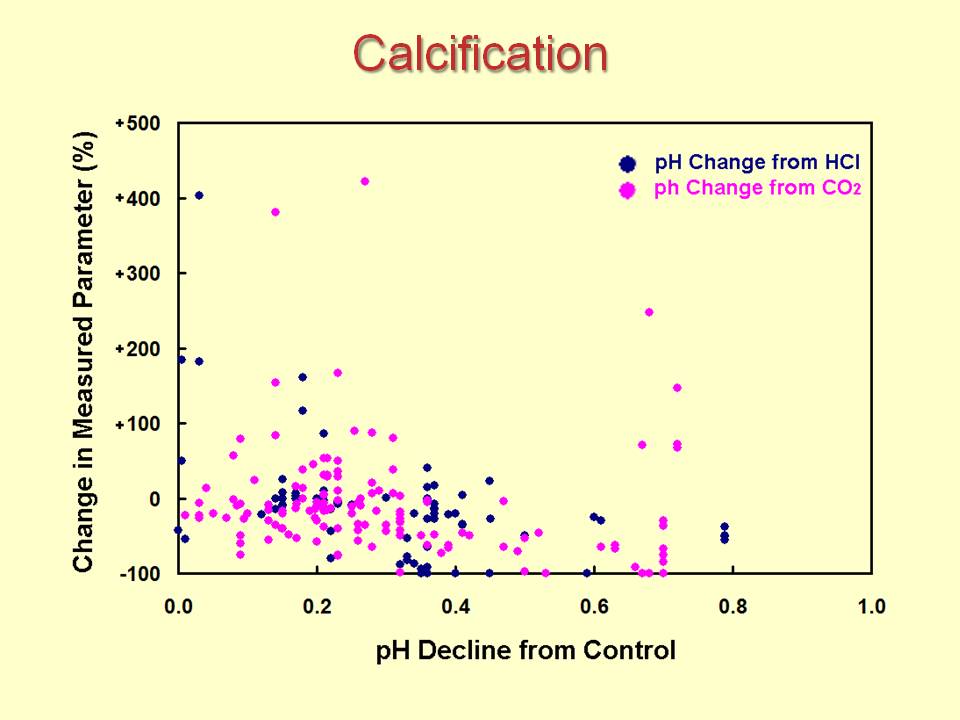
Figure 4. Percent change in calcification vs. decline of seawater pH from its present (control treatment) value, as created by addition of HCl or the bubbling of seawater with air of different CO2 concentrations, showing all individual data points.
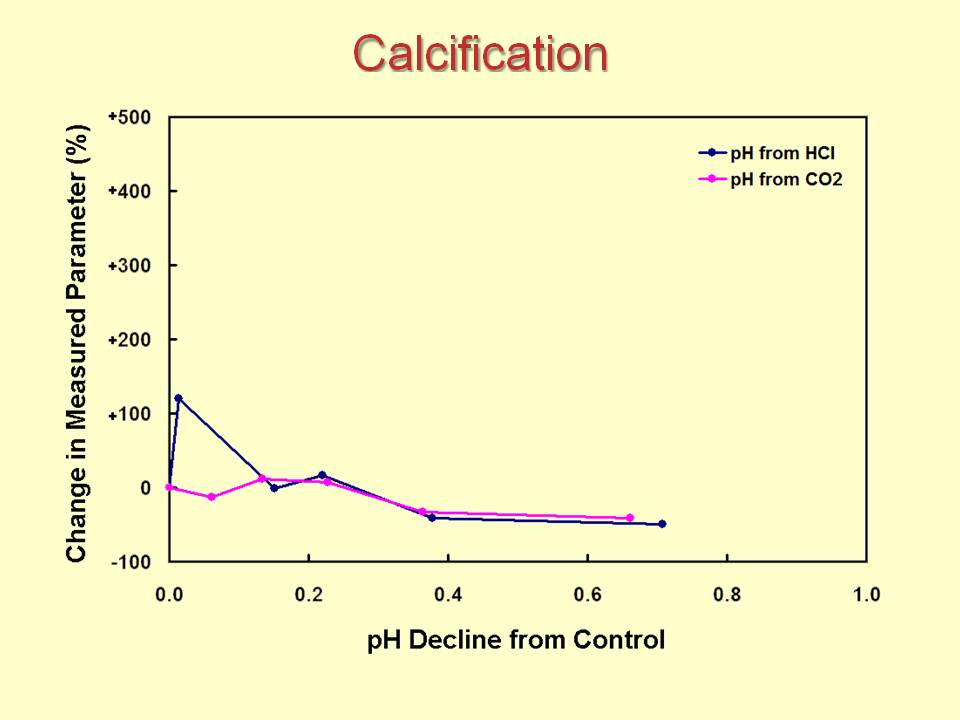
Figure 5. Percent change in calcification vs. decline of seawater pH from its present (control treatment) value, as created by addition of HCl or the bubbling of seawater with air of different CO2 concentrations, showing the mean calcification data points for the five seawater pH reduction intervals/categories defined by the figure in our Description of the Ocean Acidification Database Tables.
As can be seen from the last of these figures, initial mean results for the HCl and CO2-bubbling methods of inducing seawater-pH-decline diverge sharply, with the HCl-induced acidification data showing an extremely rapid and huge positive (more than doubling) response. However, this response could easily be spurious, due to the paucity of data points in this range and their great variability, as well as the fact that thereafter the two different means of inducing seawater acidification behave almost identically. And it is interesting to note, in this regard, that these mean results do not dip into negative-response territory until the seawater pH decline reaches a value of approximately 0.3, which is the value the IPCC suggests will be reached by about AD 2100, but which the work of Tans (2009) suggests will never be reached at all.
The next set of graphs depicts analogous presentations for the life characteristics of fertility and survival, all grouped together in Figure 6.
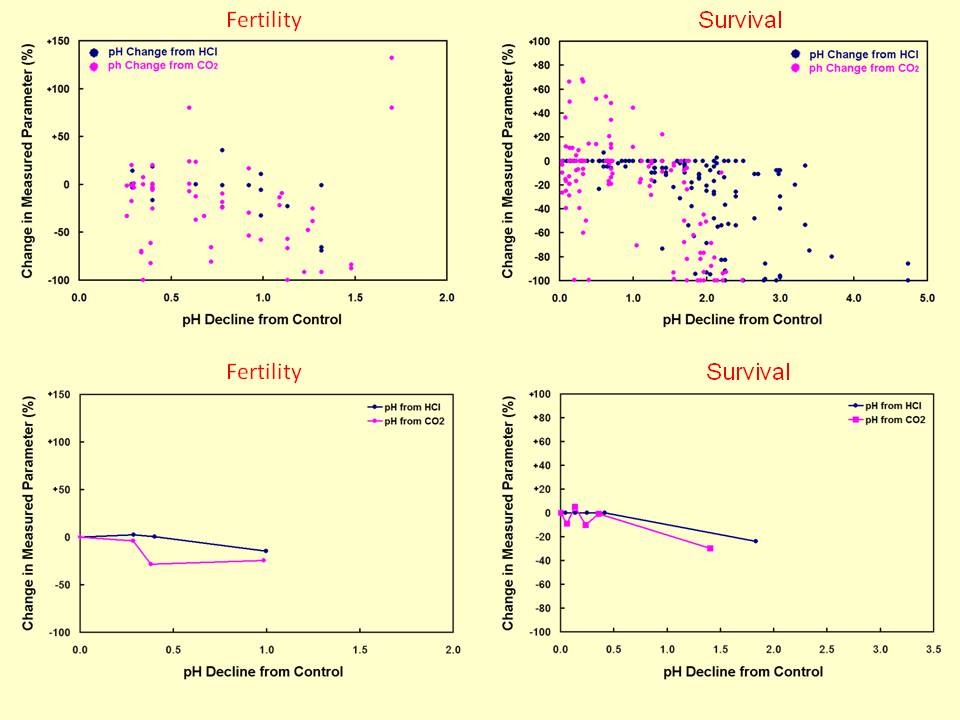
Figure 6. Percent changes in fertility (left) and survival (right) vs. decline of seawater pH from its present (control treatment) value, as created by addition of HCl or the bubbling of seawater with air of different CO2 concentrations, showing all individual data points (top) and mean data points for the five seawater pH reduction intervals/categories defined by the figure in our Description of the Ocean Acidification Database Tables (bottom).
As can be seen in this figure, there is a slight suggestion that acidification via HCl addition may produce more positive results than acidification via CO2-bubbling. In contrast, however, plots of the final two life characteristics (growth and metabolism) seem to suggest just the opposite, as shown below in Figure 7. Both possibilities could be real, or both could be spurious ... or both ways of reducing seawater pH could turn out to yield essentially identical results in the mean. We simply will have to wait for more data to become available to make up our minds on this one.
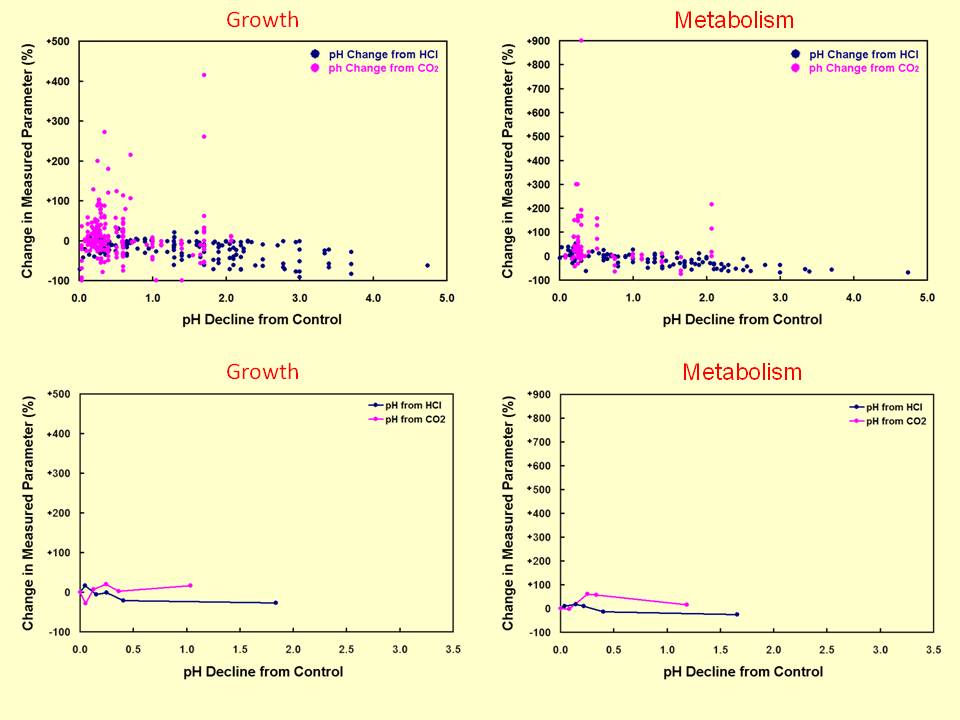
Figure 7. Percent changes in growth (left) and metabolism (right) vs. decline of seawater pH from its present (control treatment) value, as created by addition of HCl or the bubbling of seawater with air of different CO2 concentrations, showing all individual data points (top) and mean data points for the five seawater pH reduction intervals/categories defined by the figure in our Description of the Ocean Acidification Database Tables (bottom).
In the final graphical representations of the information contained in our Ocean Acidification Database, we have plotted the averages of all responses to seawater acidification (produced by additions of both HCl and CO2) for all five of the life characteristics of the various marine organisms that we have analyzed over the five pH reduction ranges that we discuss in our Description of the Ocean Acidification Database Tables, which pH ranges we illustrate in the figure below.
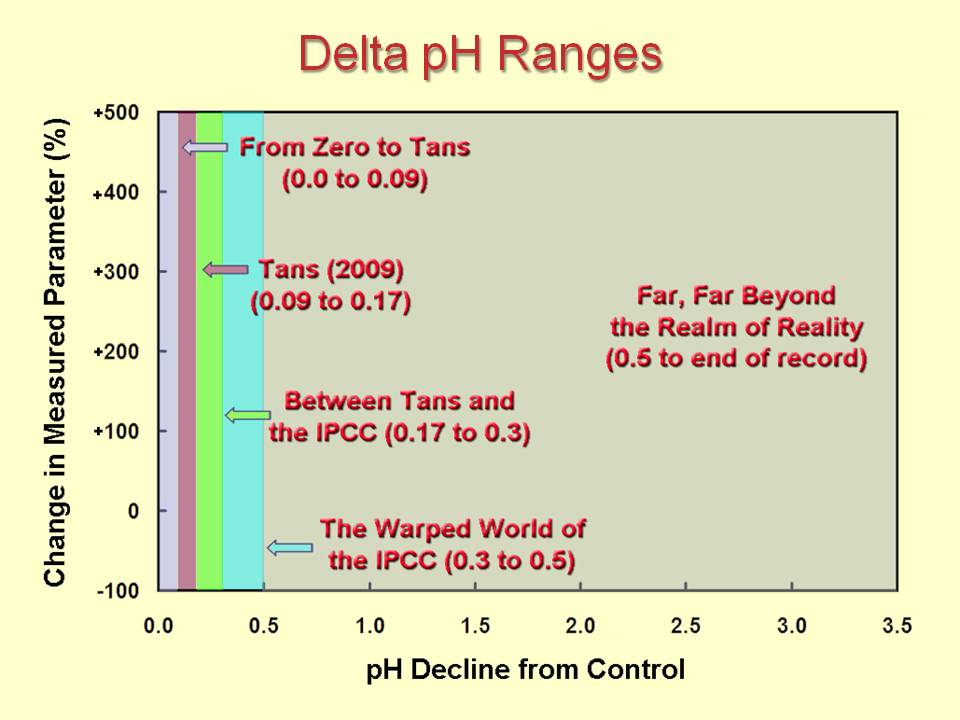
Figure 8. The five seawater pH reduction ranges discussed in our Description of the Ocean Acidification Database Tables.
The first of our "All-Studies" graphs are depicted in Figure 9 below.
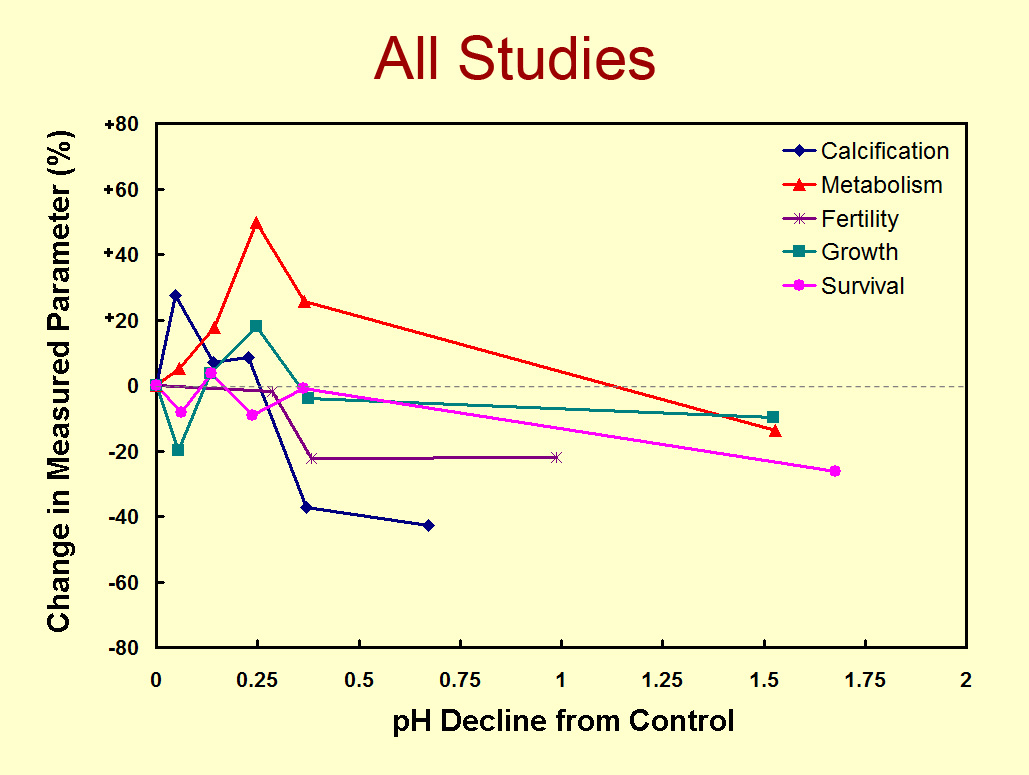
Figure 9. The mean percent changes in the five life characteristics (calcification, metabolism, growth, fertility and survival) vs. the mean declines of seawater pH from the present (control treatment) value to the mean values of the pH declines that occur within each of the five pH reduction ranges described in Figure 8, as produced by both HCl additions and CO2-bubbling.
The plots of this figure are provided simply because they account for the totality of the data contained in our Ocean Acidification Database Tables; and it can be seen from the plots that they all extend into the region we have labeled "far, far beyond the realm of reality." Therefore, in Figure 10 below, we present only the portions of the plots that extend into and through the domain of what we have denominated "the warped world of the IPCC."
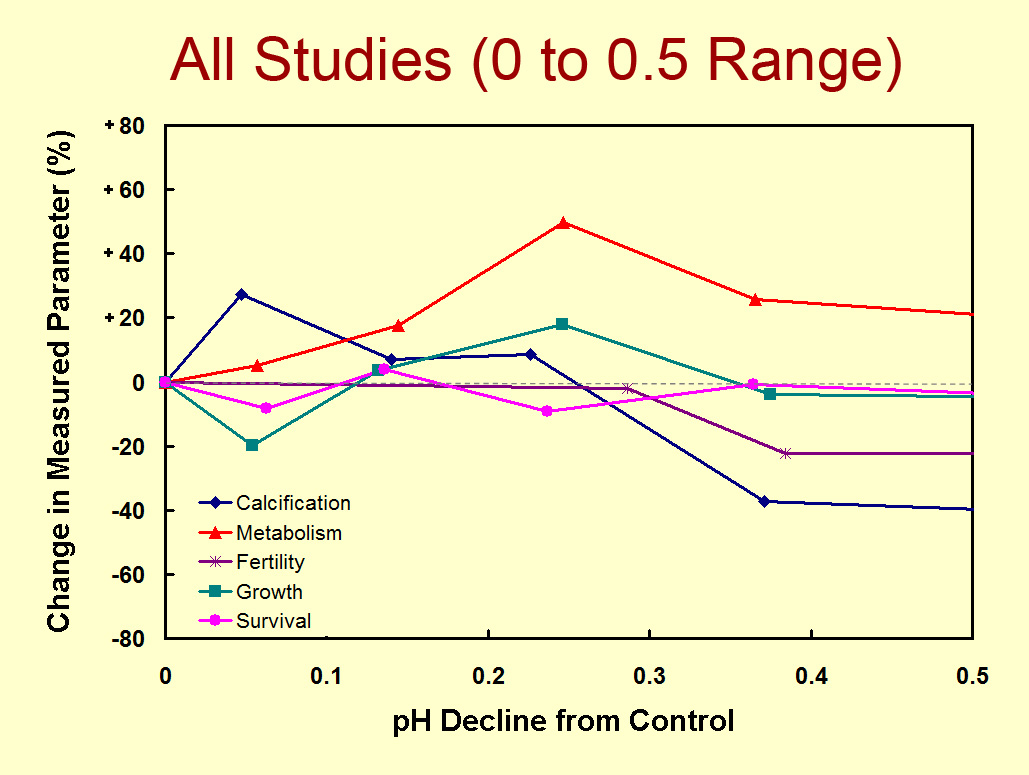
Figure 10. Same as Figure 9, but truncated at the pH value defining the end of "the warped world of the IPCC."
Then, in what could be considered a compromise between the IPCC and what the work of Tans (2009) suggests, we present in Figure 11 the portions of the graphs that extend significantly beyond the upper pH reduction limit of Tans' analysis and that end where "the warped world of the IPCC" begins.
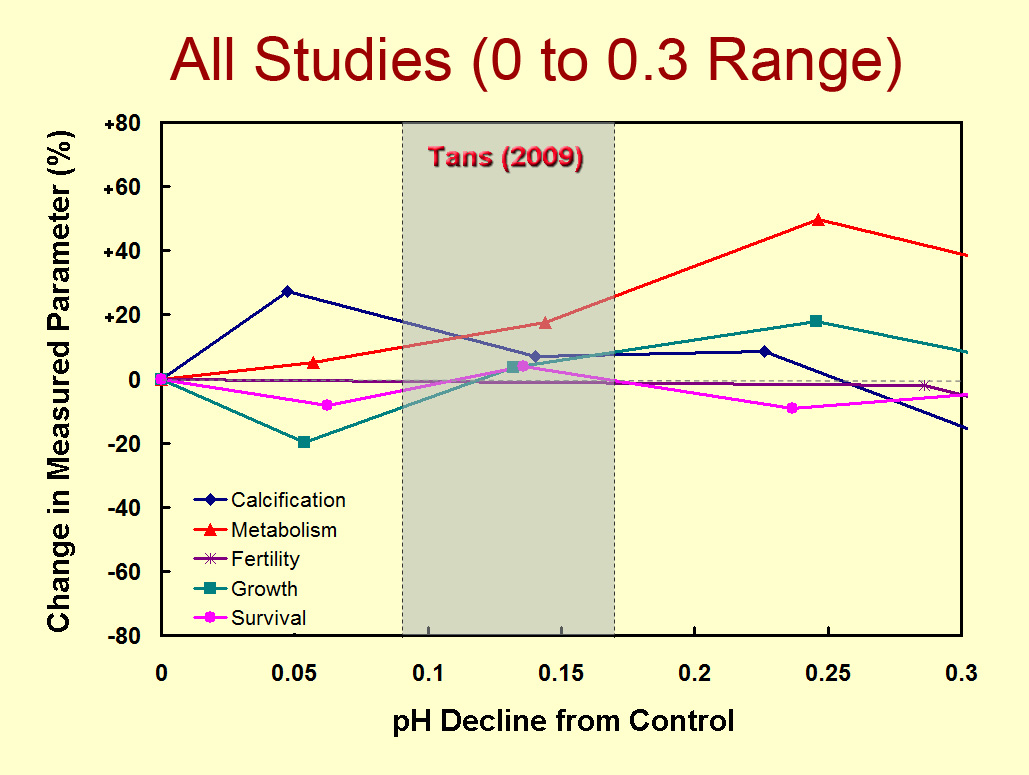
Figure 11. Same as Figure 9, but truncated at the pH value defining the beginning of "the warped world of the IPCC."
The most striking feature of Figure 11 is the great preponderance of data located in positive territory, which suggests that, on the whole, marine organisms likely will not be harmed to any significant degree by the expected decline in oceanic pH. If anything, in fact, the results suggest that the world's marine life may actually slightly benefit from the pH decline, which latter possibility is further borne out by the scatter plot of all the experimental data pertaining to all life characteristic categories over the same pH decline range, as shown below in Figure 12.
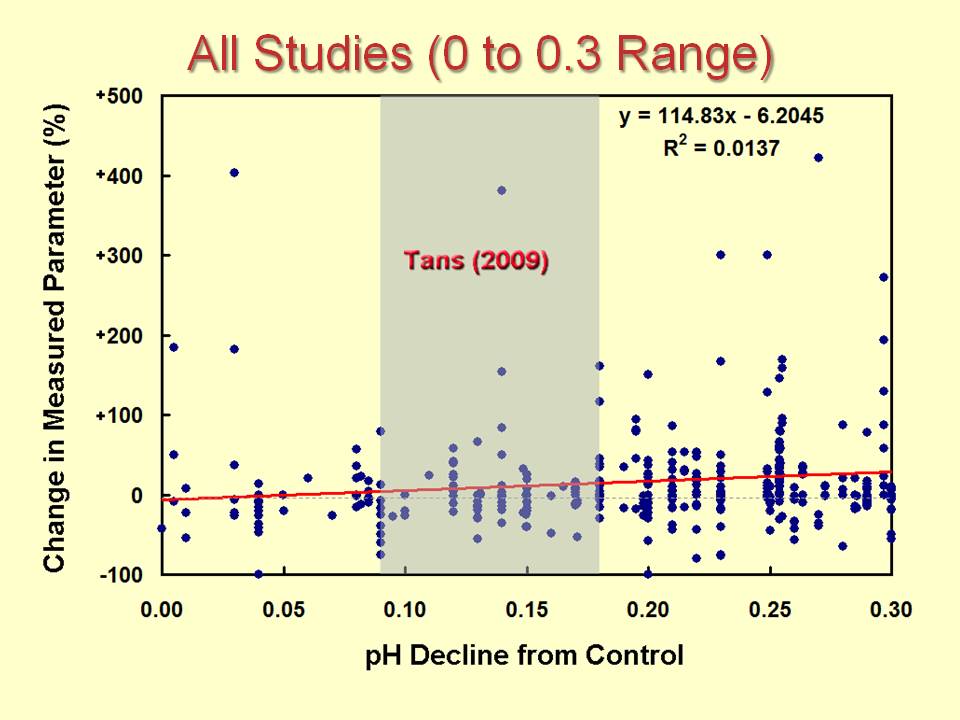
Figure 12. Percent change in the five measured life characteristics (calcification, metabolism, growth, fertility and survival) vs. decline of seawater pH from its present (control treatment) value to ending values extending up to the beginning pH value of "the warped world of the IPCC" for all individual data points falling within this pH decline range.
The results we have depicted in the figures above suggest something very different from the doomsday predictions of the climate alarmists who claim we are in "the last decades of coral reefs on this planet for at least the next ... million plus years, unless we do something very soon to reduce CO2 emissions," or who declare that "reefs are starting to crumble and disappear," that "we may lose those ecosystems within 20 or 30 years," and that "we've got the last decade in which we can do something about this problem." Clearly, the promoting of such scenarios is not supported by the vast bulk of pertinent experimental data.
Two other important phenomena that give us reason to believe the predicted decline in oceanic pH will have little to no lasting negative effects on marine life are the abilities of essentially all forms of life to adapt and evolve. Of those experiments in our database that report the length of time the organisms were subjected to reduced pH levels, for example, the median value was only four days. And many of the experiments were conducted over periods of only a few hours, which is much too short a time for organisms to adapt (or evolve) to successfully cope with new environmental conditions (see, for example, the many pertinent Journal Reviews we have archived under the general heading of Evolution in our Subject Index). And when one allows for such phenomena, the possibility of marine life experiencing a negative response to ocean acidification becomes even less likely.
In conclusion, claims of impending marine species extinctions driven by increases in the atmosphere's CO2 concentration do not appear to be founded in empirical reality, based on the experimental findings we have analyzed above.
For more information on this subject, please see the many reviews we have written on this subject that are archived under the headings of Calcification, Marine Biota, and Ocean Acidification in our Subject Index.