


Our Ocean Acidification Database is an ever-growing archive of the responses of various growth and developmental parameters of marine organisms immersed in seawater at or near today's oceanic pH level as well as lower than that of today. The measured parameters include variables that pertain to changes in calcification, growth, metabolism, fertility and survival. The data are arranged by marine organism, accessible by selecting an organism's common or scientific name; but the data have also been grouped into similar types of organisms, such as bivalves, corals, fish, nematodes phytoplankton, etc. An example of a typical record in the database, that of Blue Crab (Callinectes sapidus) pertaining to calcification, is presented below.
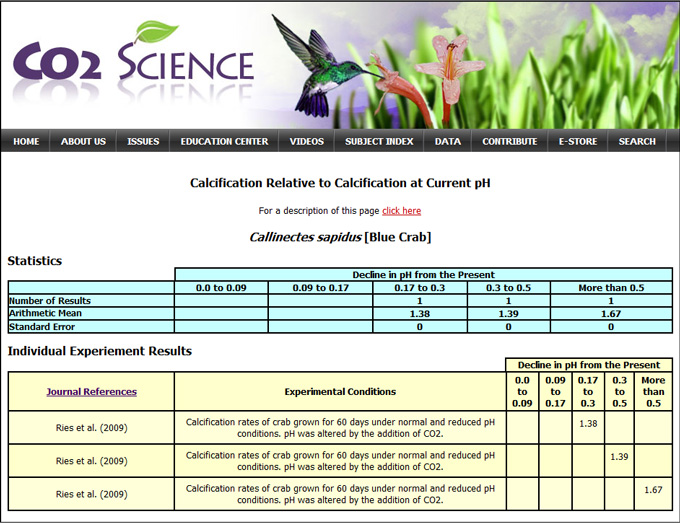
On each organism page (or grouped types of organisms) there are two data tables, one with a blue background and one with yellow. The first table (blue background) presents statistical information that is derived from the second table (yellow background) below it, and includes (1) the number of experimental results archived for that organism/category, (2) the arithmetic mean of the results, and (3) the standard error of the mean, all listed as a function of an incremental decline in pH from the present.
The second table, with the yellow background color, lists the individual experimental results. Each individual record contains three pieces of information: (1) an abbreviated reference to the journal paper from which the results were obtained, (2) a short description of the experimental conditions under which the author(s) conducted the original study (full journal citations are available by clicking on the Journal References link found at the top of the first column in this table), and (3) the change in the measured parameter (calcification, growth, metabolism, fertility or survival) relative to present seawater pH conditions, grouped into one of five categories of pH decline intervals from the present (0 to 0.09, 0.09 to 0.17, 0.17 to 0.3, 0.3 to 0.5 and More than 0.5). Changes in the measured parameters are expressed as ratios, where any number less than 1 corresponds to a decline and any number greater than 1 represents an increase, all of which values are relative to the control treatment at current pH. For example, in the figure above, a value of 1.38 in the 0.17 to 0.30 pH decline category for blue crab indicates the researchers observed a 38% increase in calcification of blue crabs relative to their calcification at current pH. Likewise, a value of 0.85 would indicate a 15% decrease in the measured parameter.
pH Decline of 0.09 to 0.17
This category represents the maximum pH decline range projected by Tans (2009), which projection is probably the most accurate and likely to occur in the future.
pH Decline of 0.3 to 0.5
This category represents the maximum pH decline range typically projected to occur by the Intergovernmental Panel on Climate Change, or IPCC.
pH Decline of More than 0.5
This category represents the pH decline range beyond that typically projected by the IPCC, and is therefore extremely unlikely to occur.
pH Decline of 0.17 to 0.3
This category represents the pH decline range between that projected by Tans (2009) and the IPCC.
pH Decline of 0 to 0.09
This category represents the pH decline range from the present to that projected by Tans (2009).
In considering the organisms' responses posted in the database, it is important to recognize that out of the 5 pH decline ranges in which the data are organized, only the first two (0 to 0.09 and 0.09 to 0.17) represent conditions that might possibly occur in the future. Beyond that, interpretation of the data becomes almost meaningless, because the larger pH decline ranges will likely never occur.
Continue onward by selecting one of the links below.