


| Tweet | Follow @co2science |
Paper Reviewed
Haverd, V., Smith, B., Canadell, J.G., Cuntz, M., Mikaloff-Fletcher, S., Farquhar, G., Woodgate, W., Briggs, P.R. and Trudinger, C.M. 2020. Higher than expected CO2 fertilization inferred from leaf to global observations. Global Change Biology, https://doi.org/10.1111/gcb.14950.
With each passing year, more and more studies are confirming what we have been predicting for decades will occur as a result of the modern rise in atmospheric CO2 -- a great greening of the globe (see the many reviews we have posted on this topic under the heading Greening of the Earth: Global, the Recent Past). The latest work to illustrate as much comes from Haverd et al. (2020).
Writing in the journal Global Change Biology, the team of nine scientists note that "four independent lines of evidence indicate intensifying terrestrial biospheric activity, namely the increasing positive trends in (a) the global net land carbon sink; (b) the amplitude of the seasonal cycle of atmospheric CO2 in the Northern Hemisphere; (c) satellite-observed leaf area; and (d) global gross primary production," citing multiple studies of supporting research. As their contribution to this body of literature, Haverd et al. set out to "reconcile leaf-level and global atmospheric constraints on trends in modeled biospheric activity" to estimate the effect of CO2 fertilization on plant photosynthesis since the year 1900. Their key finding is illustrated in the two figures below.
As shown in Figures 1 and 2, the major take-away of their work is that global gross primary production (GPP) has increased by approximately 35% since 1900. But even more impressive than this rise is the fact that it has been primarily driven by the aerial fertilization effect of atmospheric CO2 that has helped to increase plant productivity, enhance plant water use efficiency and ameliorate resource limitations and environmental stresses. Indeed, Haverd et al. report that atmospheric CO2 was responsible for the vast majority of the modern rise in GPP, directly or indirectly accounting for over 85% of the increase.
In discussing the implications of their work, Haverd et al. note that the "attribution and future projection of [GPP] trends relies on terrestrial biosphere models (TBMs) that encapsulate mechanistic understanding of the terrestrial carbon cycle and are used to inform the global carbon budget." However, they report current TBMs have underestimated the modern rise in GPP such that the portion of the GPP rise Haverd et al. attributed to CO2 fertilization is "nearly twice as high" as estimates in current TBMs. And thus they go on to show "the implications of a higher than expected CO2 fertilization effect for the future fate of the land carbon sink."
To accomplishing this secondary objective, the nine researchers incorporated their findings into the Community Atmosphere-Biosphere Land Exchange (CABLE) model to project the net land sink over the period 2006-2099 under the IPCC's RCP2.6 low emission scenario, which predicts an atmospheric CO2 peak of 440 ppm in 2050 and a temperature increase (above 1990) of 2.4°C. In so doing, they found that the terrestrial biosphere "would continue to sequester carbon well into the second half of the century, leading to a cumulative net land sink (CO2, climate, and land use change driven) of 149 PgC by the end of the century, significantly larger than the mean of the CMIP5 carbon-climate model ensemble under the RCP2.6 scenario (65 PgC)."
The take-away of this secondary objection is that current CMIP5 models grossly underestimate the future land sink, in the case of RCP2.6 emission scenario by a whopping 129%! And they do so because these supposedly state-of-the-art models fail to correctly account for the positive impacts of CO2 fertilization. And that is a pretty damning indictment of the situation.
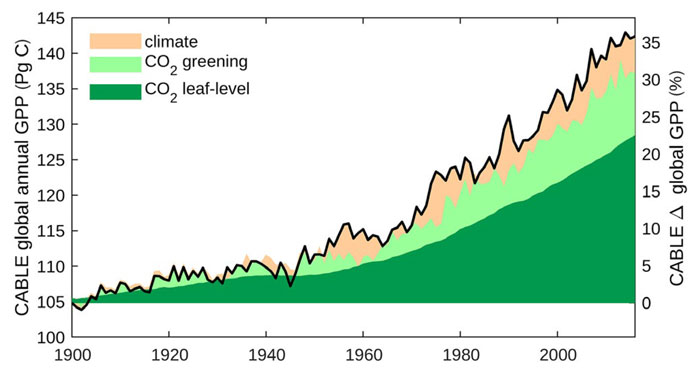
Figure 1. CO2 fertilization effect on global gross primary production (GPP), depicting a full CABLE simulation with dynamic land use (solid black line) attributed to: (i) climate effect and atmospheric CO2 x climate interaction effect (orange); (ii) CO2 greening effect (light green); (iii) CO2 leaf-level effect (dark green). Source: Haverd et al. (2020).
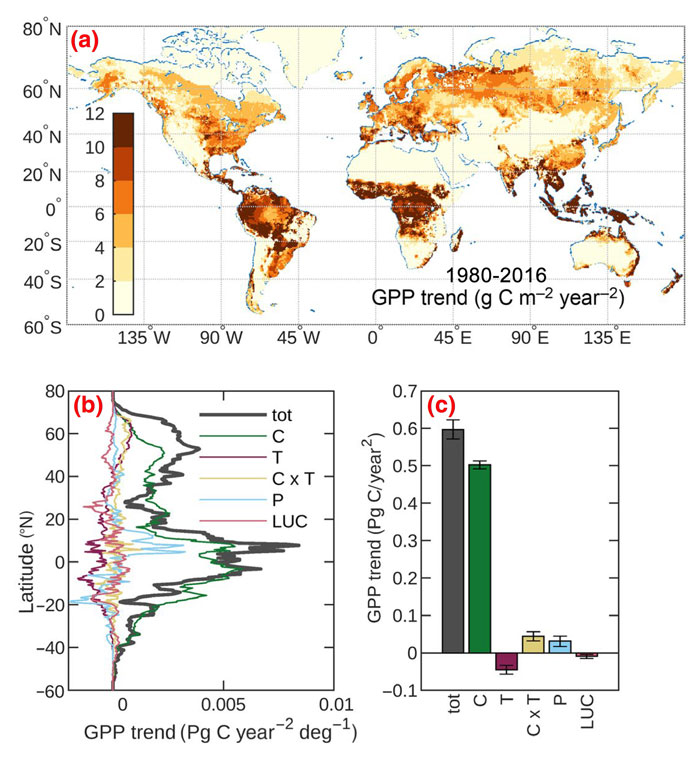
Figure 2. Spatial distribution (panel a), latitudinal distribution of component factors (panel b), and driver-attribution (panel c) of the 1980-2016 trend in global gross primary production (GPP). Tot = total effect; C = atmospheric CO2 only; T = temperature; C x T = atmospheric CO2 and temperature interaction; P = precipitation; LUC = land use change. Only major drivers are isolated. Additional drivers (nitrogen deposition; specific humidity; wind speed; incoming short and longwave radiation) and their interactions are not isolated but may contribute to the total effect. Error bars represent standard errors from linear regression fits to each driver component. Source: Haverd et al. (2020).