


Reference
Barclay, D.J., Wiles, G.C. and Calkin, P.E. 2009. Tree-ring crossdates for a first millennium AD advance of Tebenkof Glacier, southern Alaska. Quaternary Research 71: 22-26.
What was done
Noting that "tree-ring crossdates of glacially killed logs have provided a precisely dated and detailed picture of Little Ice Age (LIA) glacier fluctuations in southern Alaska," the authors extended this history back into the First Millennium AD (FMA) by integrating similar data obtained from additional log collections made in 1999 with the prior data to produce a "new-and-improved" history of advances and retreats of the Tebenkof Glacier that spans the entire past two millennia.
What was learned
In the figure that follows, it can be seen that between the FMA and LIA extensions of the Tebenkof Glacier terminus, there was a period between about AD 950 and 1230 when the terminus dropped further than two kilometers back from the maximum LIA extension that occurred near the end of the 19th century. It can also be seen that this warmer/drier period of glacier terminus retreat had to have been much more extreme than what was experienced at any time during the 20th century, because at the century's end the glacier's terminus had still not retreated more than two kilimeters back from the line of its maximum LIA extension. In addition, we note that this 280-year period of likely greater warmth/dryness corresponds precisely in time with the broad peak of maximum warmth during the global Medieval Warm Period, as defined by the abundance of data we have plotted on the Interactive Map and Time Domain feature of our Medieval Warm Period Project.
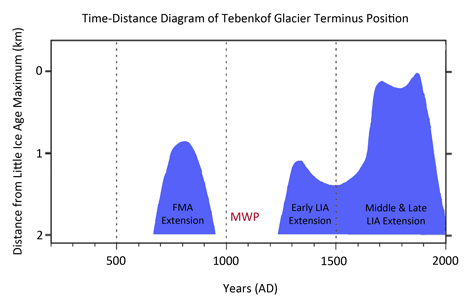
The temporal history of the distance by which the terminus of the Tebenkof Glacier fell short of its maximum LIA extension over the past two millennia. Circles indicate ice margin positions based on direct observations. Adapted from Barclay et al. (2009).
What it means
Based on the data depicted in the figure above, it would appear that the central portion of the Medieval Warm Period in southern Alaska was likely significantly warmer/drier than it was at any time during the 20th century, or at any subsequent time. As a result, we can further conclude there is nothing unprecedented or unusual about that region's current warmth/dryness, which means there is no need to invoke anthropogenic CO2 emissions as the cause of the region's current heat and moisture levels. All that is needed to have created its current warmth/dryness is just a little less of whatever caused the greater warmth/dryness of the Medieval Warm Period, which we know was not carbon dioxide.