Map Window
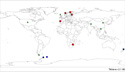 This is the main TimeMap window. Use the zoom or pan tools from the toolbar above it to focus on different parts of the world where MWP studies have been conducted. Call up information pertaining to a single study by clicking the pointer on the symbol representing it. Drag a box around multiple symbols and a new attribute window will open that contains information about the MWP at each of the enclosed locations. This is the main TimeMap window. Use the zoom or pan tools from the toolbar above it to focus on different parts of the world where MWP studies have been conducted. Call up information pertaining to a single study by clicking the pointer on the symbol representing it. Drag a box around multiple symbols and a new attribute window will open that contains information about the MWP at each of the enclosed locations.
|
Zoom In
 Either (1) click on the "+" symbol and then click on a spot on the map to zoom in on the area that surrounds the spot or (2) click and drag to create a rectangle about a portion of the map and then release to zoom in on the enclosed area. Either (1) click on the "+" symbol and then click on a spot on the map to zoom in on the area that surrounds the spot or (2) click and drag to create a rectangle about a portion of the map and then release to zoom in on the enclosed area.
|
Zoom Out
 When viewing a close-up portion of the map, click on the "-" symbol and then click on a spot of the map that you would like to view in a more expanded context. When viewing a close-up portion of the map, click on the "-" symbol and then click on a spot of the map that you would like to view in a more expanded context.
|
Pan
 Select this tool to drag or move (pan) the view of the map after you have zoomed in on it. Select this tool to drag or move (pan) the view of the map after you have zoomed in on it.
|
Pointer
 Using the pointer symbol, click on one of the MWP study locations on the main map to pull up a new window containing descriptive information about the MWP at that location. You may also click and drag the pointer on the map to pull up a new window displaying attribute data for all of the enclosed MWP locations. Highlight a row and then click the Link button at the top of the window to pull up more descriptive information. Click the On Map button to move the position of the selected
site to the center of the map window. In addition, note that attribute data can be
sorted by clicking on column headings at the top of the window. Using the pointer symbol, click on one of the MWP study locations on the main map to pull up a new window containing descriptive information about the MWP at that location. You may also click and drag the pointer on the map to pull up a new window displaying attribute data for all of the enclosed MWP locations. Highlight a row and then click the Link button at the top of the window to pull up more descriptive information. Click the On Map button to move the position of the selected
site to the center of the map window. In addition, note that attribute data can be
sorted by clicking on column headings at the top of the window.
|
Animation
 Click on this symbol to run a time animation sequence of the data on the map. A new window will open that allows you to select the start year, end year, time span, time step and other pertinent parameters. Click on this symbol to run a time animation sequence of the data on the map. A new window will open that allows you to select the start year, end year, time span, time step and other pertinent parameters.
|
Status Panel
 Located underneath the scale bar and above the time bar, the status panel provides descriptive information about several of the map's features. When you move the pointer over many, but not all, of the map function icons, a description of the icon's function will be displayed here. Located underneath the scale bar and above the time bar, the status panel provides descriptive information about several of the map's features. When you move the pointer over many, but not all, of the map function icons, a description of the icon's function will be displayed here.
|
Scale & Location
 Continuously displays the latitude and longitude of the location of the pointer in decimal degrees and shows the distance in km across the bottom of the map. Continuously displays the latitude and longitude of the location of the pointer in decimal degrees and shows the distance in km across the bottom of the map.
|
Time Bar
 Click and drag the white arrows located on both sides of the pink shaded area of the time bar to change the time domain in which the data are viewed. You may also adjust the time domain using the buttons located on the left hand side of the time bar. Click and drag the white arrows located on both sides of the pink shaded area of the time bar to change the time domain in which the data are viewed. You may also adjust the time domain using the buttons located on the left hand side of the time bar.
|
Time Graph
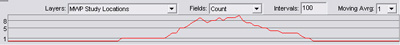 Shows the temporal distribution of all MWP time intervals. Shows the temporal distribution of all MWP time intervals.
|
Log Button
 If some aspect of the map fails, this button will turn red. Pressing it will bring up a log screen. Send its contents to us for troubleshooting. If some aspect of the map fails, this button will turn red. Pressing it will bring up a log screen. Send its contents to us for troubleshooting.
|
Predefined Zoom
 Contains spatial bookmarks. Choosing an option from the list will make the main map window focus on the specified area. Contains spatial bookmarks. Choosing an option from the list will make the main map window focus on the specified area.
|
Legend Panel
 Identifies symbols used on the map to plot the locations of the three different levels of MWP studies. Identifies symbols used on the map to plot the locations of the three different levels of MWP studies.
|
Key Map
 Provides a view of the entire world, no matter how small a portion of it you are viewing in the main map space. Click and drag on the key map to define a red rectangular area that will appear in the main map. Provides a view of the entire world, no matter how small a portion of it you are viewing in the main map space. Click and drag on the key map to define a red rectangular area that will appear in the main map.
|
Zoom All
 Expands all layers of the map to their maximum spatial extent. Expands all layers of the map to their maximum spatial extent.
|