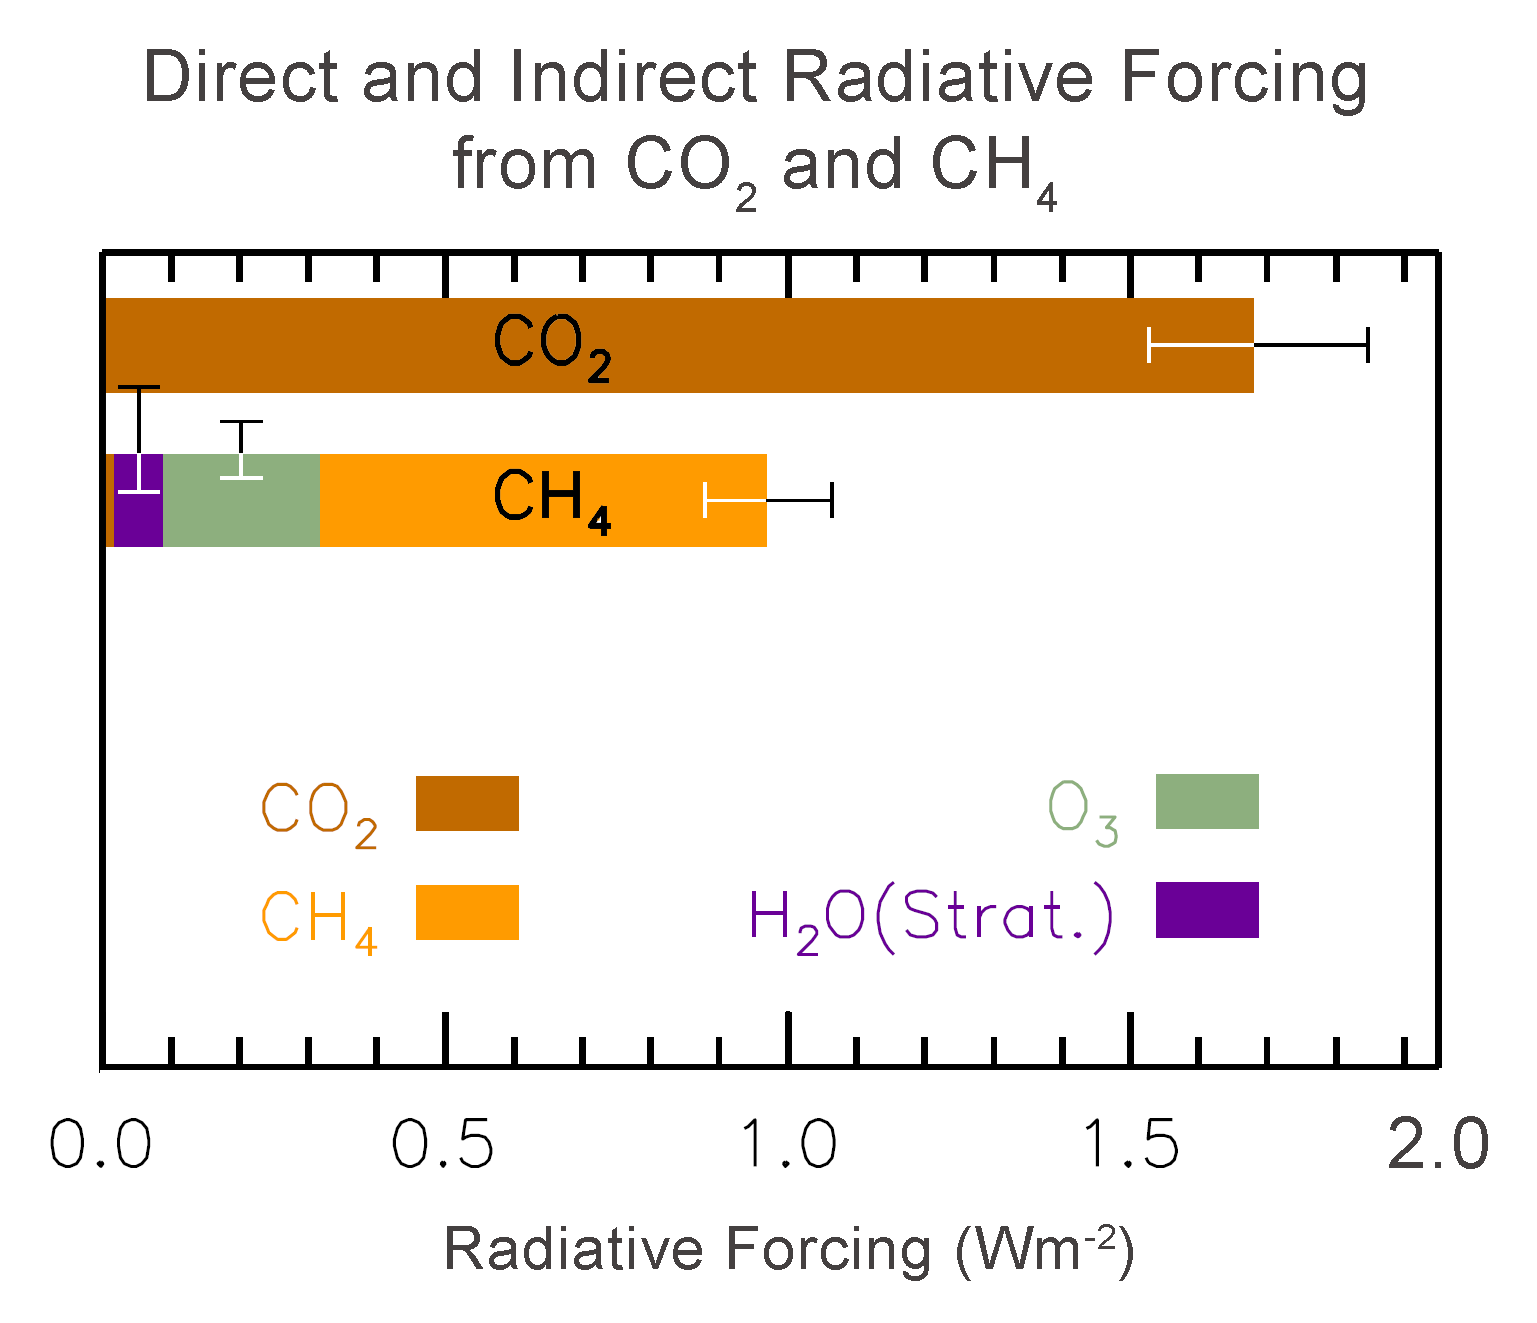
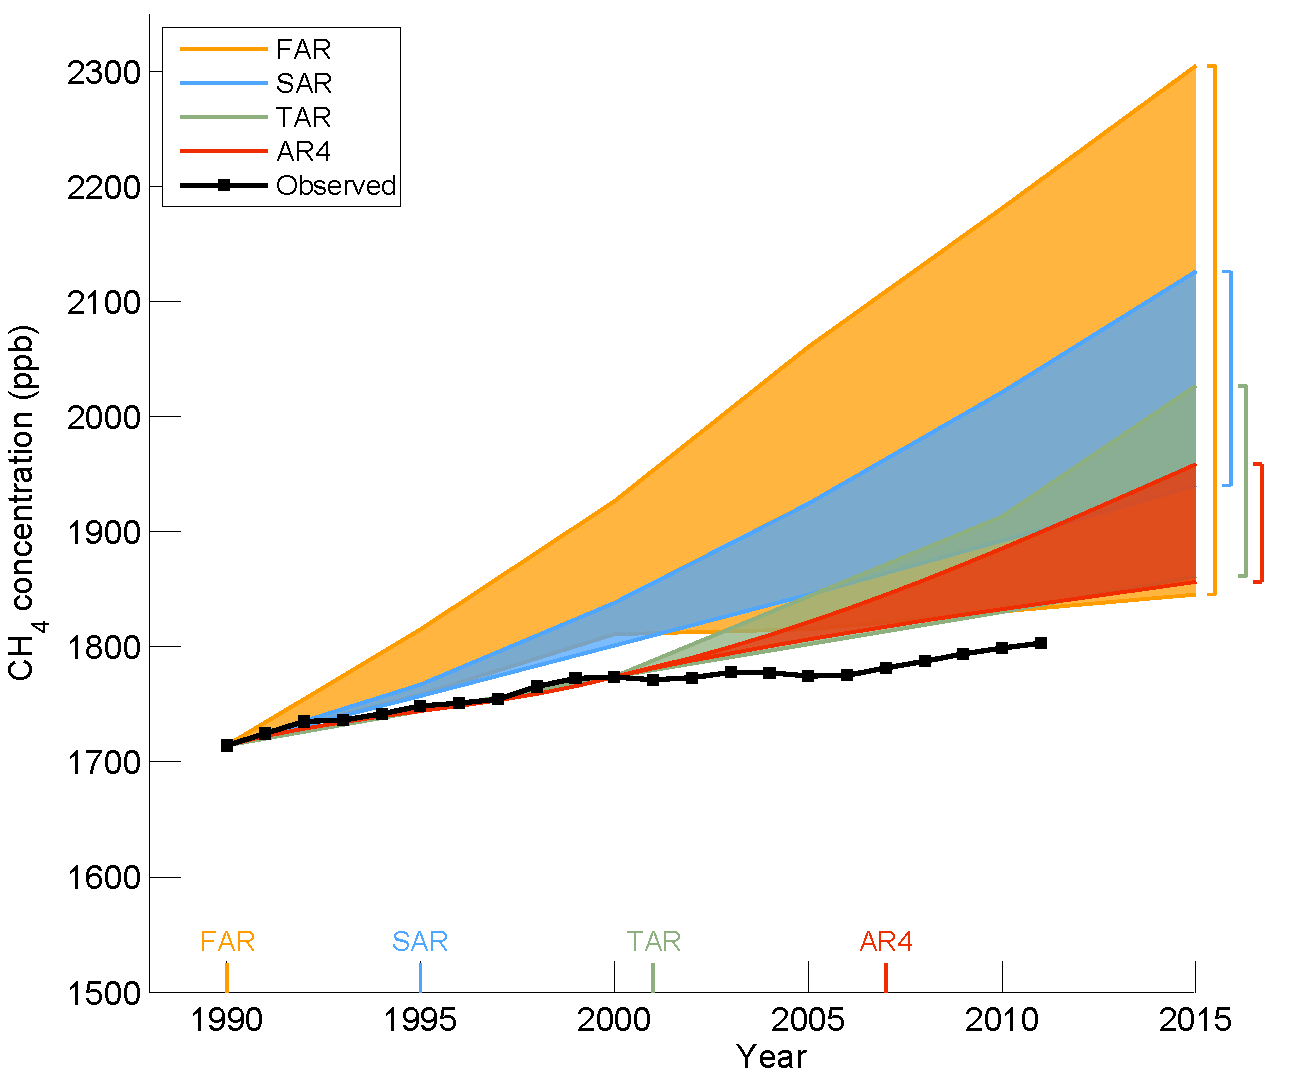
Atmospheric methane's contribution to anthropogenic climate forcing is estimated to be about half that of CO2 when both direct and indirect components to its forcing are summed (see Figure 1, below); and nearly all models project atmospheric methane (CH4) concentrations will increase for at least the next 3 decades, with many of the scenarios assuming a much larger increase throughout the 21st century. A quick fact-check, however, reveals that observations lie far below the model projections, as shown in each of the four prior Assessment Reports of the IPCC. So what has caused the IPCC to get things so wrong?
 Figure 1. Direct and indirect radiative forcing from CO2 and CH4, as estimated by the IPCC. |
 Figure 2. Atmospheric CH4 projections vs observations for the first four IPCC Assessment Reports. |
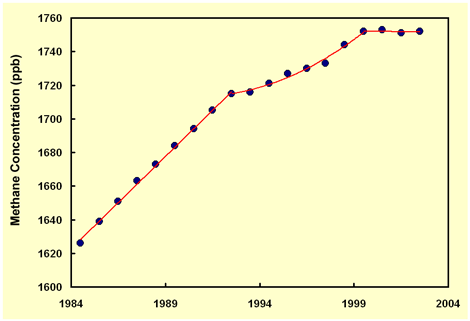
Shortly after the first IPCC Assessment Report, it was recognized by various researchers that the past two centuries' dramatic increase in the atmosphere's methane content, which was sparked by the Industrial Revolution, was abruptly slowing down (Dlugokencky et al., 1998; Francey et al., 1999; Lassey et al., 2000). Based on measurements from 43 globally-distributed remote boundary-layer sites, Dlugokencky et al. (2003), for example, calculated global CH4 concentration averages for the years 1984-2002. In extracting the results from their graphical presentation and re-plotting them as shown in Figure 3 below, it can be seen that they fall into three natural groupings: initial and latter stages, to which has been fit linear regressions, and an intervening middle stage, to which has been fit a second-order polynomial.

Figure 3. Global tropospheric methane (CH4) concentration vs. time. Adapted from Dlugokencky et al. (2003).
With respect to these data, Dlugokencky et al. noted that the globally-averaged atmospheric methane concentration "was constant at ~1751 ppb from 1999 through 2002," which suggested, in their words, that "during this 4-year period the global methane budget has been at steady state." However, they cautioned that "our understanding is still not sufficient to tell if the prolonged pause in CH4 increase is temporary or permanent."
Although initially contending in a paper published in 2002 (Simpson et al. (2002)) that it was "premature to believe that the CH4 burden is ceasing to increase," four years later Simpson et al. (2006) acknowledged just the opposite, i.e., that the anomalous CH4 growth spikes to which Simpson et al. (2002) had referred were indeed "superimposed on an overall slowdown of the CH4 growth rate." In fact, the slowdown documented by Simpson et al. (2006) was so significant that they reported that "the global growth rate of atmospheric CH4 has been near-zero for the past seven years, averaging 0.7 +/- 2.6 ppbv year-1." What is more, they report that "opportunities exist for still further reductions," noting that "CH4 levels may decrease if various CH4 emission mitigation strategies are implemented." In addition, they further noted that "the reduction of fossil fuel leakage has promise," and that "because the leaking fossil fuels have high value in the market, these mitigation steps can in some cases even be economically favorable."
The ramifications of the playing out of the above scenario are huge. Because "methane has been second only to carbon dioxide in enhanced climatic forcing from 1750 to the present," in the words of Simpson et al., a continuously-negative atmospheric CH4 growth rate could allow the air's CO2 content to continue to rise with little to no net increase in the radiative forcing of climate, while at the same time allowing the aerial fertilization and anti-transpirant effects of atmospheric CO2 enrichment to grow in magnitude and thereby enhance the water and nutrient use efficiencies of both natural and managed ecosystems. In addition, because methane is "an important source of tropospheric ozone," as related by Simpson et al. (2006), the declining CH4 concentration would alleviate much of the damage to Earth's vegetation that is routinely caused by this most debilitating of air pollutants.
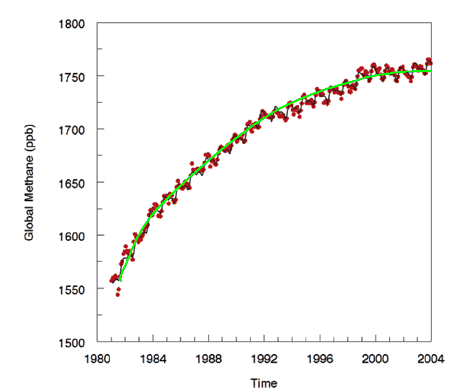
Additional research on the subject was published one year later. In combining two huge atmospheric methane data sets, Khalil et al. (2007) produced the unified dataset depicted in Figure 4.

Figure 4. Global methane (CH4) concentration. Adapted from Khalil et al. (2007).
In viewing Figure 4, it is clear that the rate of methane increase in the atmosphere has dropped dramatically over time. As Khalil et al. describe it, "the trend has been decreasing for the last two decades until the present when it has reached near zero," and they go on to say that "it is questionable whether human activities can cause methane concentrations to increase greatly in the future."
Similar findings were reported in 2008 by Schnell and Dlugokencky, who presented an update through 2007 of atmospheric methane concentrations as determined from weekly discrete samples collected on a regular basis since 1983 at the NOAA/ESRL Mauna Loa Observatory. An adaptation of the graphical rendition of these authors' data is presented in Figure 5. In commenting on these data, Schnell and Dlugokencky state that "atmospheric CH4 has remained nearly constant since the late 1990s," the exact cause(s) of which decline "are still unclear."

Figure 5. Trace gas mole fractions of methane (CH4) as measured at Mauna Loa, Hawaii. Adapted from Schnell and Dlugokencky (2008).
In a contemporaneous study, Rigby et al. (2008) analyzed CH4 data obtained from the Advanced Global Atmospheric Gases Experiment (AGAGE) -- a network of five stations located in coastal regions at latitudes from 53°N to 41°S -- and the Australian Commonwealth Scientific and Industrial Research Organization (CSIRO) -- a network of eight locations around the globe that "provides an independent and complementary data set, and a wider latitudinal site distribution." In doing so, the sixteen scientists report that their methane measurements, which run from January 1997 to April 2008, "show renewed growth from the end of 2006 or beginning of 2007 until the most recent measurements," with the record-long range of methane growth rates mostly hovering about zero, but sometimes dropping five parts per billion (ppb) per year into the negative range, while rising near the end of the record to mean positive values of 8 and 12 ppb per year for the two measurement networks.
But does this recent increase provide renewed support or vindication of the IPCC's projected increase in methane used in their model calculations of future global temperature? In a word, no - or at least not yet; for it is important to note that over the past two to three decades much larger increases in the methane growth rate have occurred. For example, as indicated in the most recent graphic on global methane data from NOAA scientist Dr. Ed Dlugokencky, Figure 6 copied below, after falling for nearly two decades the global growth rate of methane experience a short rise in 2004. However, that increase peaked three years later in 2007. And since then, the methane growth rate has once again been declining.

Figure 6. Global average growth rate of methane from the Carbon Cycle cooperative air sampling network, and published by Ed Dlugokencky on the NOAA website http://www.esrl.noaa.gov/gmd/ccgg/.
Whither will the atmospheric concentration of methane go in the future? No one really knows. Given the direct and indirect radiative properties of this well-mixed greenhouse gas, interest in the topic will remain high in the years and decades to come, yet only the passing of time will confirm the validity of growth rate scenarios used by the IPCC in their projections of future climate. But if the past has taught us anything at all, it is that we clearly do not know all that we need to know about the factors that both contribute to (the sources), and extract from (the sinks), methane in the atmosphere. That fact should be strikingly evident to the IPCC, whose methane projections have consistently outstretched the reality of observations in each of their prior 4 Assessments, as illustrated earlier in Figure 2. And given the direct and indirect radiative properties of CH4, it is clear that the IPCC-based temperature projections are likely inflated as well.
References
Dlugokencky, E.J., Houweling, S., Bruhwiler, L., Masarie, K.A., Lang, P.M., Miller, J.B. and Tans, P.P. 2003. Atmospheric methane levels off: Temporary pause or a new steady-state? Geophysical Research Letters 30: 10.1029/2003GL018126.
Dlugokencky, E.J., Masarie, K.A., Lang, P.M. and Tans, P.P. 1998. Continuing decline in the growth rate of the atmospheric methane burden. Nature 393: 447-450.
Francey, R.J., Manning, M.R., Allison, C.E., Coram, S.A., Etheridge, D.M., Langenfelds, R.L., Lowe, D.C. and Steele, L.P. 1999. A history of 13C in atmospheric CH4 from the Cape Grim Air Archive and Antarctic firn air. Journal of Geophysical Research 104: 23,631-23,643.
Khalil, M.A.K., Butenhoff, C.L. and Rasmussen, R.A. 2007. Atmospheric methane: Trends and cycles of sources and sinks. Environmental Science & Technology 10.1021/es061791t.
Lassey, K.R., Lowe, D.C. and Manning, M.R. 2000. The trend in atmospheric methane 13C and implications for constraints on the global methane budget. Global Biogeochemical Cycles 14: 41-49.
Rigby, M., Prinn, R.G., Fraser, P.J., Simmonds, P.G., Langenfelds, R.L., Huang, J., Cunnold, D.M., Steele, L.P., Krummel, P.B., Weiss, R.F., O'Doherty, S., Salameh, P.K., Wang, H.J., Harth, C.M., Muhle, J. and Porter, L.W. 2008. Renewed growth of atmospheric methane. Geophysical Research Letters 35: 10.1029/2008GL036037.
Schnell, R.C. and Dlugokencky, E. 2008. Methane. In: Levinson, D.H. and Lawrimore, J.H., Eds. State of the Climate in 2007. Special Supplement to the Bulletin of the American Meteorological Society 89: S27.
Simpson, I.J., Blake, D.R. and Rowland, F.S. 2002. Implications of the recent fluctuations in the growth rate of tropospheric methane. Geophysical Research Letters 29: 10.1029/2001GL014521.
Simpson, I.J., Rowland, F.S., Meinardi, S. and Blake, D.R. 2006. Influence of biomass burning during recent fluctuations in the slow growth of global tropospheric methane. Geophysical Research Letters 33: 10.1029/2006GL027330.
Last updated 8 May 2013


