


Climate alarmists generally contend that current temperatures are both unnatural and unprecedented, as a result of global warming caused by anthropogenic CO2 emissions; and they claim that this "unnaturalness" is most strongly expressed throughout the world's Arctic regions. We here investigate this claim within the context of the latter part of the current interglacial or Holocene, based on scientific studies conducted in this climatically-sensitive part of the planet.
We begin with the study of Overpeck et al. (1997), who combined paleoclimatic records obtained from lake and marine sediments, trees and glaciers to develop a 400-year history of circum-Arctic surface air temperature. From this record they determined that the most dramatic warming of the last four centuries of the past millennium (1.5°C) occurred between 1840 and 1955, over which period the air's CO2 concentration rose from approximately 285 ppm to 313 ppm, or by 28 ppm. Then, from 1955 to the end of the record (about 1990), the mean circum-Arctic air temperature actually declined by 0.4°C, while the air's CO2 concentration rose from 313 ppm to 354 ppm, or by 41 ppm. On the basis of these observations, which apply to the entire Arctic, it is not possible to assess the influence of atmospheric CO2 on surface air temperature or to even conclude that it has any effect at all. Why? Because over the first 115 years of warming, as the air's CO2 concentration rose by an average of 0.24 ppm/year, air temperature rose by an average of 0.013°C/year; while over the final 35 years of the record, when the increase in the air's CO2 content really began to accelerate, rising at a mean rate of 1.17 ppm/year (nearly five times the rate at which it had risen in the prior period), the rate-of-rise of surface air temperature did not accelerate anywhere near that fast. In fact, it did not accelerate at all. In fact, it decelerated, to a mean value (0.011°C/year) that was nearly the same as the rate at which it had previously risen; but over this latter period it went in the opposite direction, i.e., it declined, which is just the opposite of what one would have expected on the basis of climate-alarmist contentions.
Fast-forwarding three years, we come to the study of Naurzbaev and Vaganov (2000), who developed a 2200-year temperature history using tree-ring data obtained from 118 trees near the upper-timberline in Siberia for the period 212 BC to AD 1996, as well as a similar history covering the period of the Holocene Climatic Optimum (3300 to 2600 BC), after which they compared their results with those obtained from an analysis of isotopic oxygen data extracted from a Greenland ice core. This work revealed that fluctuations in average annual temperature derived from the Siberian record agreed well with air temperature variations reconstructed from the Greenland data, suggesting to the two researchers that "the tree ring chronology of [the Siberian] region can be used to analyze both regional peculiarities and global temperature variations in the Northern Hemisphere."
That being said, Naurzbaev and Vaganov reported that several warm and cool periods prevailed for several multi-century periods throughout the last two millennia: a cool period in the first two centuries AD, a warm period from AD 200 to 600, cooling again from 600 to 800 AD, followed by the Medieval Warm Period from about AD 850 to 1150, the cooling of the Little Ice Age from AD 1200 though 1800, followed by the recovery warming of the 20th century. In regard to this latter temperature rise, however, the two scientists say it was "not extraordinary," and that "the warming at the border of the first and second millennia [AD 1000] was longer in time and similar in amplitude." In addition, their reconstructed temperatures for the Holocene Climatic Optimum revealed there was an even warmer period about 5000 years ago, when temperatures averaged 3.3°C more than they did over the past two millennia.
Contemporaneously, Vaganov et al. (2000) also used tree-ring width as a temperature proxy, reporting temperature variations for the Asian subarctic region over the past 600 years. Their graph of these data reveals that temperatures in this region exhibited a small positive trend from the beginning of the record until about AD 1750. Thereafter, a severe cooling trend ensued, followed by a 130-year warming trend from about 1820 through 1950, after which temperatures fell once again.
In analyzing the entire record, the researchers determined that the amplitude of 20th-century warming "does not go beyond the limits of reconstructed natural temperature fluctuations in the Holocene subarctic zone." And in attempting to determine the cause or causes of the temperature fluctuations, they report finding a significant correlation with solar radiation and volcanic activity over the entire 600-year period (r = 0.32 for solar radiation, r = -0.41 for volcanic activity), which correlation improved over the shorter interval (1800-1990) of the industrial period (r = 0.68 for solar radiation, r = -0.59 for volcanic activity). It is also enlightening to note, in this regard, that in this region of the world, where climate models predict large increases in temperature as a result of the historical rise in the air's CO2 concentration, real-world data show an actual cooling trend since around 1940, when the greenhouse effect of CO2 should have been most powerful; and where warming does exist in the record -- between about 1820 and 1940 -- much of it correlates with changes in solar irradiance and volcanic activity, two factors that are free of anthropogenic influence.
Working with directly-measured instrumental temperature records, Przybylak (2000) used mean monthly values from 37 Arctic and 7 sub-Arctic stations, as well as temperature anomalies of 30 grid-boxes obtained from the updated data set of Jones, to derive a number of spatial and temporal histories of Arctic near-surface air temperature. These analyses led, in the researcher's words, to the following conclusions: (1) "In the Arctic, the highest temperatures since the beginning of instrumental observation occurred clearly in the 1930s." (2) "Even in the 1950s the temperature was higher than in the last 10 years," (3) "Since the mid-1970s, the annual temperature shows no clear trend," and (4) "The level of temperature in Greenland in the last 10-20 years is similar to that observed in the 19th century." Consequently, Przybylak concluded that "the observed variations in air temperature in the real Arctic are in many aspects not consistent with the projected climatic changes computed by climatic models for the enhanced greenhouse effect," because "the temperature predictions produced by numerical climate models significantly differ from those actually observed."
One year later, Moore et al. (2001) analyzed sediment cores extracted from Donard Lake, Baffin Island, Canada (~66.25°N, 62°W), to produce a 1240-year record of mean summer temperature for this region that averaged 2.9°C over the period AD 750-1990. Within this period there were several anomalously warm decades with temperatures that were as high as 4°C around AD 1000 and 1100, while at the beginning of the 13th century Donard Lake witnessed what they called "one of the largest climatic transitions in over a millennium," as "average summer temperatures rose rapidly by nearly 2°C from AD 1195-1220, ending in the warmest decade in the record," with temperatures near 4.5°C. This latter temperature rise was then followed by a period of extended warmth that lasted until an abrupt cooling event occurred around AD 1375, resulting in the following decade being one of the coldest in the record and signaling the onset of the Little Ice Age on Baffin Island, which lasted for 400 years. At the modern end of the record, a gradual warming trend occurred over the period 1800-1900, followed by a dramatic cooling event that brought temperatures back to levels characteristic of the Little Ice Age, which chilliness lasted until about 1950. Thereafter, temperatures rose once more throughout the 1950s and 60s, whereupon they trended downwards toward cooler conditions to the end of the record in 1990, a final result that was far cry indeed from the "unprecedented warmth" claimed by climate alarmists to have characterized most of the planet during the late 20th century.
In another revealing study, Gedalof and Smith (2001) compiled a transect of six tree ring-width chronologies from stands of mountain hemlock growing near the treeline that extends from southern Oregon to the Kenai Peninsula, Alaska, analyzing the data in such a way as to "directly relate changes in radial growth to annual variations in the North Pacific ocean-atmosphere system." Over the period of their study (AD 1599-1983), they determined that "much of the pre-instrumental record in the Pacific Northwest region of North America [was] characterized by alternating regimes of relatively warmer and cooler SST [sea surface temperature] in the North Pacific, punctuated by abrupt shifts in the mean background state," which were found to be "relatively common occurrences." In fact, they concluded that "regime shifts in the North Pacific have occurred 11 times since 1650." A significant aspect of these findings is the fact that the abrupt 1976-77 shift in this Pacific Decadal Oscillation, as it is generally called, is what was responsible for the vast majority of the past half-century's warming in Alaska, which climate alarmists wrongly hype as evidence of gradual CO2-induced global warming.
About the same time, Kasper and Allard (2001) examined soil deformations caused by ice wedges (a widespread and abundant form of ground ice in permafrost regions that can grow during colder periods and deform and crack the soil). Working near Salluit, northern Quebéc (approx. 62°N, 75.75°W), they found evidence of ice wedge activity prior to AD 140, reflecting cold climatic conditions. Between AD 140 and 1030, however, this activity decreased, reflective of warmer conditions. Then, from AD 1030 to 1500, conditions cooled; and from 1500 to 1900 ice wedge activity was at its peak, when the Little Ice Age ruled, suggesting that this climatic interval exhibited the coldest conditions of the past 4000 years. Thereafter, however, a warmer period prevailed, from about 1900 to 1946, which was followed by a return to cold conditions during the last five decades of the 20th century, during which time over 90% of the ice wedges studied reactivated and grew upwards by 20-30 cm, in harmony with a reported temperature decline of 1.1°C observed at the meteorological station in Salluit, which cooling was vastly different from what climate alarmists contend was occurring (unprecedented warming) throughout the earth during this same period of time.
In another study from the same year, Zeeberg and Forman (2001) analyzed 20th-century changes in glacier terminus positions on north Novaya Zemlya, a Russian island located between the Barents and Kara Seas in the Arctic Ocean, providing in the process a quantitative assessment of the effects of temperature and precipitation on glacial mass balance. This work revealed a significant and accelerated post-Little Ice Age glacial retreat in the first and second decades of the 20th century; but by 1952, the region's glaciers had experienced between 75 to 100% of their net 20th-century retreat. During the next 50 years, the recession of over half of the glaciers stopped, and many tidewater glaciers actually began to advance. These glacial stabilizations and advances were attributed by the two scientists to observed increases in precipitation and/or decreases in temperature. In the four decades since 1961, for example, weather stations at Novaya Zemlya show summer temperatures to have been 0.3 to 0.5°C colder than they were over the prior 40 years, while winter temperatures were 2.3 to 2.8°C colder than they were over the prior 40-year period. Such observations, in Zeeberg and Forman's words, are "counter to warming of the Eurasian Arctic predicted for the twenty-first century by climate models, particularly for the winter season."
Also appearing in 2001 was the report of the work of Comiso et al., who utilized satellite imagery to analyze and quantify a number of attributes of the Odden ice tongue (a winter ice-cover phenomenon that occurs in the Greenland Sea with a length of about 1300 km and an aerial coverage of as much as 330,000 square kilometers), including its average concentration, maximum area, and maximum extent over the period 1979-1998. In addition, they used surface air temperature data from Jan Mayen Island, located within the region of study, to infer the behavior of the phenomenon over the past 75 years.
The Odden ice tongue was found to vary in size, shape and length of occurrence during the 20-year period, displaying a fair amount of interannual variability. Quantitatively, trend analyses revealed that the ice tongue had exhibited no statistically significant change in any of the parameters studied over the short 20-year period. However, a proxy reconstruction of the Odden ice tongue for the past 75 years revealed the ice phenomenon to have been "a relatively smaller feature several decades ago," due to the significantly warmer temperatures that prevailed at that time.
The fact that the Odden ice tongue has persisted, virtually unchanged in the mean during the past 20-years, is in direct contrast with climate-alarmist predictions of rapid and increasing warmth in earth's polar regions as a result of CO2-induced global warming. This observation, along with the observational evidence from Jan Mayen Island that temperatures there actually cooled at a rate of 0.15 +/- 0.03°C per decade during the past 75 years, thus bolsters the climate-realist claim that there has been little to no warming in this part of the Arctic, as well as most of its other parts, over the past seven decades.
Creeping ahead one more year, Polyakov et al. 2002b) used newly available long-term Russian observations of surface air temperature from coastal stations to gain new insights into trends and variability in the Arctic environment poleward of 62°N. Throughout the 125-year history they developed, they identified "strong intrinsic variability, dominated by multi-decadal fluctuations with a timescale of 60-80 years;" and because of this fact, they found temperature trends in the Arctic to be highly dependent on the particular time period selected for analysis. In fact, they found they could "identify periods when Arctic trends were actually smaller or of different sign [our italics] than Northern Hemisphere trends." Over the bulk of the 20th century, however, when they say "multi-decadal variability had little net effect on computed trends," the temperature histories of the two regions were "similar," but they did "not support amplified warming in polar regions predicted by GCMs."
In a concomitant study, Naurzbaev et al. (2002) developed a 2,427-year proxy temperature history for the part of the Taimyr Peninsula, northern Russia, lying between 70°30' and 72°28' North latitude, based on a study of ring-widths of living and preserved larch trees, noting that it has been shown that "the main driver of tree-ring variability at the polar timber-line [where they worked] is temperature (Vaganov et al., 1996; Briffa et al., 1998; Schweingruber and Briffa, 1996)." This work revealed that "the warmest periods over the last two millennia in this region were clearly in the third [Roman Warm Period], tenth to twelfth [Medieval Warm Period] and during the twentieth [Current Warm Period] centuries." With respect to the second of these three periods, they emphasize that "the warmth of the two centuries AD 1058-1157 and 950-1049 attests to the reality of relative mediaeval warmth in this region." Their data also reveal three other important pieces of information: (1) the Roman and Medieval Warm Periods were both warmer than the Current Warm Period has been to date, (2) the beginning of the end of the Little Ice Age was somewhere in the vicinity of 1830, and (3) the Current Warm Period peaked somewhere in the vicinity of 1940.
All of these observations are at odds with what is portrayed in the Northern Hemispheric hockeystick temperature history of Mann et al. (1998, 1999) and its thousand-year global extension developed by Mann and Jones (2003), wherein (1) the Current Warm Period is depicted as the warmest such era of the past two millennia, (2) recovery from the Little Ice Age does not begin until after 1910, and (3) the Current Warm Period experiences its highest temperatures in the latter part of the 20th century's final decade. We hasten to add, however, that these results apply to but the specific portion of the planet studied by the four researchers; but that there are many such "specific portions of the planet" that tell much the same story, as we have already seen, and as we shall see again and again hereafter.
In one final study from 2002, Przybylak conducted a detailed analysis of intraseasonal (within season) and interannual (between years) variability in maximum, minimum and average air temperature and diurnal air temperature range for the entire Arctic -- as delineated by Treshnikov (1985) -- for the period 1951-1990, based on data from ten stations "representing the majority of the climatic regions in the Arctic." This work indicated that trends in both the intraseasonal and interannual variability of the temperatures studied did not show any significant changes," leading Przybylak to conclude that "this aspect of climate change, as well as trends in average seasonal and annual values of temperature investigated earlier (Przybylak, 1997, 2000), proves that, in the Arctic in the period 1951-90, no tangible manifestations of the greenhouse effect can be identified."
Moving ahead another year, Isaksson et al. (2003) retrieved two ice cores (one from Lomonosovfonna and one from Austfonna) far above the Arctic Circle in Svalbard, Norway, after which the twelve cooperating scientists from Norway, Finland, Sweden, Canada, Japan, Estonia and the Netherlands used δ18O data to reconstruct a 600-year temperature history of the region. As would be expected -- in light of the earth's transition from the Little Ice Age to the Current Warm Period -- the international group of scientists reported that "the δ18O data from both Lomonosovfonna and Austfonna ice cores suggest that the 20th century was the warmest during at least the past 600 years." However, the warmest decade of the 20th century was centered on approximately 1930, while the instrumental temperature record at Longyearbyen also shows the decade of the 1930s to have been the warmest. In addition, the authors remark that, "as on Svalbard, the 1930s were the warmest decade in the Trondheim record." Consequently, there was no net warming over the last seven decades of the 20th century in the parts of Norway cited in this study, when and where climate alarmists say CO2-induced warming should have been most evident.
In the same year, Polyakov et al. (2003) derived a surface air temperature history that stretched from 1875 to 2000, based on measurements carried out at 75 land stations and a number of drifting buoys located poleward of 62°N latitude. From 1875 to about 1917, the team of eight U.S. and Russian scientists found that the surface air temperature of the huge northern region rose hardly at all; but then it took off like a rocket, climbing 1.7°C in just 20 years to reach a peak in 1937 that was not eclipsed over the remainder of the record. During this 20-year period of rapidly rising air temperature, the atmosphere's CO2 concentration rose by a mere 8 ppm. But then, over the next six decades, when the air's CO2 concentration rose by approximately 55 ppm, or nearly seven times more than it did throughout the 20-year period of dramatic warming that preceded it, the surface air temperature of the region poleward of 62°N experienced no net warming and, in fact, may have actually cooled a bit.
The situation in Greenland has been much the same. Working with data from three coastal stations in southern and central Greenland that possessed almost uninterrupted temperature records between 1950 and 2000, Chylek et al. (2004) discovered that "summer temperatures, which are most relevant to Greenland ice sheet melting rates, do not show any persistent increase during the last fifty years." In fact, working with the two stations with the longest records (both over a century in length), they determined that coastal Greenland's peak temperatures occurred between 1930 and 1940, and that the subsequent decline in temperature was so substantial and sustained that temperatures there at the end of the millennium were "about 1°C below their 1940 values." Also, they found that "at the summit of the Greenland ice sheet the summer average temperature has decreased at the rate of 2.2°C per decade since the beginning of the measurements in 1987." Therefore, much of Greenland did not experience any net warming over the most dramatic period of atmospheric CO2 increase on record. In fact, it actually cooled during that period ... and cooled significantly.
At the start of the 20th century, however, Greenland was warming, as it emerged, along with the rest of the world, from the depths of the Little Ice Age. What is more, between 1920 and 1930, when the atmosphere's CO2 concentration rose by a mere 3 to 4 ppm, there was a phenomenal warming at all five coastal locations for which contemporary temperature records are available. In fact, in the words of Chylek et al., "average annual temperature rose between 2 and 4°C [and by as much as 6°C in the winter] in less than ten years." And this warming, as they note, "is also seen in the 18O/16O record of the Summit ice core (Steig et al., 1994; Stuiver et al., 1995; White et al., 1997)."
In commenting on this dramatic temperature rise, which they called the great Greenland warming of the 1920s, Chylek et al. concluded that "since there was no significant increase in the atmospheric greenhouse gas concentration during that time, the Greenland warming of the 1920s demonstrates that a large and rapid temperature increase can occur over Greenland, and perhaps in other regions of the Arctic, due to internal climate variability such as the NAM/NAO [Northern Annular Mode/North Atlantic Oscillation], without a significant anthropogenic influence."
Also working in Greenland, Taurisano et al. (2004) studied the temperature history of the Nuuk fjord during the last century, where their analyses of all pertinent regional data led them to conclude that "at all stations in the Nuuk fjord, both the annual mean and the average temperature of the three summer months (June, July and August) exhibit a pattern in agreement with the trends observed at other stations in south and west Greenland (Humlum 1999; Hanna and Cappelen, 2003)." As they describe it, the temperature data "show that a warming trend occurred in the Nuuk fjord during the first 50 years of the 1900s, followed by a cooling over the second part of the century, when the average annual temperatures decreased by approximately 1.5°C." Coincident with this cooling trend there was also what they describe as "a remarkable increase in the number of snowfall days (+59 days)." What is more, they report that "not only did the cooling affect the winter months, as suggested by Hannna and Cappelen (2002), but also the summer mean," noting that "the summer cooling is rather important information for glaciological studies, due to the ablation-temperature relations."
Briffa et al. (2004) next reviewed several prior analyses of maximum latewood density data obtained from a widespread network of tree-ring chronologies that spanned three to six centuries and were derived from nearly 400 locations. For the land area of the globe poleward of 20°N latitude, they too found that the warmest period of the past six centuries occurred in the 1930s and early 1940s. Thereafter, the region's temperature dropped dramatically, although it did recover somewhat over the last two decades of the 20th century. Nevertheless, its final value was still less than the mean value of the entire 1400s and portions of the 1500s.
Averaged across all land area poleward of 50°N latitude, however, there was a large divergence of reconstructed and instrumental temperatures subsequent to 1960, with measured temperatures rising and reconstructed temperatures falling, such that by the end of the record there was an approximate 1.5°C difference between them. Briffa et al. attempted to relate this large temperature differential to an hypothesized decrease in tree growth that was caused by an hypothesized increase in ultraviolet radiation that they hypothesized to have been caused by declining stratospheric ozone concentrations over this period. The results of their effort, however, proved "equivocal," as they themselves described it, leaving room for a growing urban heat island effect in the instrumental temperature record to be the principal cause of the disconcerting data divergence; and the three researchers wrote that these unsettled questions prevented them "from claiming unprecedented hemispheric warming during recent decades on the basis of these tree-ring density data."
About the same time that Briffa et al. were struggling with this perplexing problem, Polyakov et al. (2004) were developing a long-term history of Atlantic Core Water Temperature (ACWT) in the Arctic Ocean using high-latitude hydrographic measurements that were initiated in the late 19th century, after which they compared the results of this exercise with the long-term history of Arctic Surface Air Temperature (SAT) developed by Polyakov et al. (2003). Their ACWT record, to quote them, revealed the existence of "two distinct warm periods from the late 1920s to 1950s and in the late 1980s-90s and two cold periods, one at the beginning of the record (until the 1920s) and another in the 1960s-70s." The SAT record depicted essentially the same thing, with the peak temperature of the latter warm period being not quite as high as the peak temperature of the former warm period. In the case of the ACWT record, however, this relationship was reversed, with the peak temperature of the latter warm period slightly exceeding the peak temperature of the former warm period. But the most recent temperature peak was very short-lived; and it rapidly declined to hover around a value that was approximately 1°C cooler over the last few years of the record.
In discussing their findings, Polyakov et al. say that, like Arctic SATs, Arctic ACWTs are dominated, in their words, "by multidecadal fluctuations with a time scale of 50-80 years." In addition, both records indicate that late 20th-century warmth was basically no different from that experienced in the late 1930s and early 1940s. Hence, there is no compelling reason to believe that late 20th-century warmth was the result of CO2-induced global warming, for the air's CO2 concentration in the late 1930s and early 1940s was fully 65 ppm less than it is today, yet the warmth of that period was essentially equivalent to that of today.
Also in 2004, Knudsen et al. documented climatic changes over the last 1200 years via high-resolution multi-proxy studies of benthic and planktonic foraminiferal assemblages, stable isotopes, and ice-rafted debris found in three sediment cores retrieved from the North Icelandic shelf. These efforts resulted in their learning that "the time period between 1200 and around 7-800 cal. (years) BP, including the Medieval Warm Period, was characterized by relatively high bottom and surface water temperatures," after which "a general temperature decrease in the area marks the transition to ... the Little Ice Age." They also found that "minimum sea-surface temperatures were reached at around 350 cal. BP, when very cold conditions were indicated by several proxies." Thereafter, they report that "a modern warming of surface waters ... is not [our italics] registered in the proxy data," and that "there is no clear indication of warming of water masses in the area during the last decades," even in sea surface temperatures measured over the period 1948-2002. Once again, therefore, we find something far, far different than unprecedented warming over the last decades of the 20th century.
Another interesting study that was published at about the same time was that of Raspopov et al. (2004), who presented and analyzed two temperature-related data sets. The first was "a direct and systematic air temperature record for the Kola Peninsula, in the vicinity of Murmansk," which covered the period 1880-2000, while the second was an "annual tree-ring series generalized for 10 regions (Lovelius, 1997) along the northern timberline, from the Kola Peninsula to Chukotka, for the period 1458-1975 in the longitude range from 30°E to 170°E," which included nearly all of northern Eurasia that borders the Arctic Ocean.
The researchers' primary objectives in this work were to identify any temporal cycles that might be present in the two data sets and to determine what caused them. With respect to this dual goal, they report discovering "climatic cycles with periods of around 90, 22-23 and 11-12 years," which were found to "correlate well with the corresponding solar activity cycles." Of even more interest, however, was what they learned about the temporal development of the Current Warm Period (CWP).
Raspopov et al.'s presentation of the mean annual tree-ring series for the northern Eurasia timberline clearly shows that the region's thermal recovery from the coldest temperatures of the Little Ice Age (LIA) may be considered to have commenced as early as 1820 and was in full swing by at least 1840. In addition, it shows that the rising temperature peaked just prior to 1950 and then declined to the end of the record in 1975. Thereafter, however, the Kola-Murmansk instrumental record indicates a significant temperature rise that peaked in the early 1990s at about the same level as the pre-1950 peak; but after that time, the temperature once again declined to the end of the record in 2000.
The latter of these findings (that there has been no net warming of this expansive high-latitude region over the last half of the 20th-century) is in harmony with the findings of the many studies reviewed above, while the former finding (that the thermal recovery of this climatically-sensitive region of the planet began in the first half of the nineteenth century) is also supported by a number of other studies (Esper et al., 2002; Moore et al., 2002; Yoo and D'Odorico, 2002; Gonzalez-Rouco et al., 2003; Jomelli and Pech, 2004), all of which demonstrate that the Little Ice Age-to-Current Warm Period transition began somewhere in the neighborhood of 1820 to 1850, well before the date (~1910) that is indicated in the Mann et al. (1998, 1999) "hockeystick" temperature history that is promulgated by the IPCC and its climate-alarmist friends.
This difference is very important, for it indicates that the LIA-to-CWP transition in the Arctic was likely halfway or more complete before the Mann et al. temperature history suggests it even began, demonstrating that the major portion of the transition occurred well in advance of the vast bulk of humanity's historical CO2 emissions. And adding to this observation the fact that there was no net warming between somewhere in the 1930s or 40s and the end of the 20th century ... in the part of the world where CO2-induced global warming is supposed to be most evident (the Arctic) ... it becomes abundantly clear that anthropogenic CO2 emissions have had no discernable impact on any part of the LIA-to-CWP transition, which is the "global warming" climate alarmists continue to claim is still occurring and can be stopped by reducing CO2 emissions.
One further study from 2004 yields much the same conclusion, but arrives at it by very different means. Benner et al. set the stage for what they did by stating that "thawing of the permafrost which underlies a substantial fraction of the Arctic could accelerate carbon losses from soils (Goulden et al., 1998)." In addition, they report that "freshwater discharge to the Arctic Ocean is expected to increase with increasing temperatures (Peterson et al., 2002), potentially resulting in greater riverine export of terrigenous organic carbon to the ocean." And since the organic carbon in Arctic soils, in their words, "is typically old, with average radiocarbon ages ranging from centuries to millennia (Schell, 1983; Schirrmeister et al., 2002)," they set about to measure the age of dissolved organic carbon (DOC) in Arctic rivers to see if there were any indications of increasing amounts of older carbon being transported to the ocean, which (if there were) would be indicative of enhanced regional warming. Specifically, they sampled two of the largest Eurasian rivers, the Yenisey and Ob' (which drain vast areas of boreal forest and extensive peat bogs, accounting for about a third of all riverine DOC discharge to the Arctic Ocean), as well as two much smaller rivers on the north slope of Alaska, the Ikpikpuk and Kokolik, whose watersheds are dominated by Arctic tundra. In doing so, they found modern radiocarbon ages for all samples taken from all rivers, which indicates, in their words, that Arctic riverine DOC "is derived primarily from recently-fixed plant litter and near-surface soil horizons." Thus, because warming should have caused the average radiocarbon age of the DOC of Arctic rivers to increase, the absence of aging implied by their findings provides strong evidence for the absence of recent large-scale warming there.
Finally breaking free of 2004, Laidre and Heide-Jorgensen (2005) published a most unusual paper, in that it dealt with the danger of oceanic cooling. Using a combination of long-term satellite tracking data, climate data and remotely sensed sea ice concentrations to detect localized habitat trends of narwhals in Baffin Bay between Greenland and Canada -- which is home to the largest narwhal population in the world -- they studied the species' vulnerability to recent and possible future climate trends. In doing so, they found that "since 1970, the climate in West Greenland has cooled [our italics], reflected in both oceanographic and biological conditions (Hanna and Cappelen, 2003)," with the result that "Baffin Bay and Davis Strait display strong significant increasing [our italics] trends in ice concentrations and extent, as high as 7.5% per decade between 1979 and 1996, with comparable increases detected back to 1953 (Parkinson et al., 1999; Deser et al., 2000; Parkinson, 2000a,b; Parkinson and Cavalieri, 2002; Stern and Heide-Jorgensen, 2003)." The two researchers also report that "cetacean occurrence is generally negatively correlated with dense or complete ice cover due to the need to breathe at the surface," and that "lacking the ability to break holes in the ice," narwhals are vulnerable to reductions in the amount of open water available to them, as has been demonstrated by ice entrapment events "where hundreds of narwhals died during rapid sea ice formation caused by sudden cold periods (Siegastad and Heide-Jorgensen, 1994; Heide-Jorgensen et al., 2002)," which events were becoming ever more likely as temperatures continued to decline and sea ice cover and variability increased, which latter two trends were found by them to be "highly significant at or above the 95% confidence level." Hence, they concluded that "with the evidence of changes in sea ice conditions that could impact foraging, prey availability, and of utmost importance, access to the surface to breathe, it is unclear how narwhal sub-populations will fare in light of changes in the high Arctic."
We come next to an original item we posted as an editorial on our website on 12 Jan 2005, entitled Recent Arctic Temperatures: Unusual or Nothing Special? We began by noting that a long succession of climate models had consistently suggested that CO2-induced global warming should be significantly amplified in earth's polar regions, and that the first signs of man's predicted impact on the world's weather should be manifest there. As Meadows (2001) had described it, "the place to watch for global warming -- the sensitive point, the canary in the coal mine -- is the Arctic." So we decided to check it out and see just what level of warmth the Arctic had achieved to that point in time.
Working with the Jones et al. and Global Historical Climatology Network (GHCN) databases of the World Temperatures section of our website, we calculated the difference between the ten-year mean maximum temperature of each 10-degree latitude band of the Northern Hemisphere -- which occurred at various times for the different latitude bands between the late 1930s and early 1950s (mid-century Tmax) and the most recent ten-year mean maximum temperature (end-century Tmax) that occurred over the most recent ten years of the available records (1994-2003). The figure below depicts our results in the form of a graph of mid-century Tmax minus end-century Tmax vs. latitude, where the plotted data points are averages of the Jones et al. and GHCN results, except for the 80-90°N latitude belt, where there were insufficient data to obtain a result from the GHCN database.
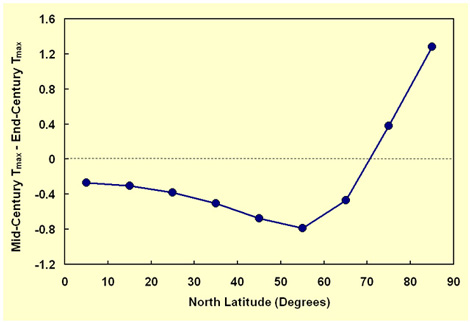
As can be seen from this figure, the warmth of the 1994-2003 period was indeed greater than that of the mid-20th-century maximum everywhere from the equator to 70°N. In the Arctic, however -- from 70°N to the pole -- the earlier maximum was greater, and by a relatively large amount.
These temperature measurements constitute a major problem for the world's climate alarmists. The real-world data either totally destroy their contention that "the place to watch for global warming -- the sensitive point, the canary in the coal mine -- is the Arctic," or, if this statement is true, they totally destroy their more basic premise, i.e., that CO2-induced global warming is occurring; for they reveal a significant cooling of the Arctic between 1940 and 1998 (the mean midpoints of the ten-year periods used to define the mid-century and end-century mean maximum temperatures of the Arctic), over which time the atmosphere experienced its greatest increase in CO2 concentration of the entire industrial era: a rise of 60 ppm, which constitutes close to 70% of the entire increase that occurred from the inception of the Industrial Revolution through 1998.
Consequently, in response to the question posed in the title of our Editorial -- Recent Arctic Temperatures: Unusual or Nothing Special? -- we are forced to conclude they have indeed been nothing special. In addition, it should be obvious to even the most casual of observers that this finding argues strongly against the existence of a CO2-induced greenhouse effect that is anywhere near the magnitude of what is claimed by the world's climate alarmists, as that hypothesized phenomenon appears to have been totally overpowered by the natural decadal oscillation that produced the warmer temperatures of the late 1930s to early 1950s and the cooler temperatures of the 1960s and 1970s, from which the Arctic has yet to fully recover.
Also in 2005, Humlum et al. noted that state-of-the-art climate models were predicting that "the effect of any present and future global climatic change will be amplified in the polar regions as a result of feedbacks in which variations in the extent of glaciers, snow, sea ice and permafrost, as well as atmospheric greenhouse gases, play key roles." However, they also said that Polyakov et al. (2002a,b) had "presented updated observational trends and variations in Arctic climate and sea-ice cover during the twentieth century, which do not support the modeled polar amplification of surface air-temperature changes observed by surface stations at lower latitudes," and that "there is reason, therefore, to evaluate climate dynamics and their respective impacts on high-latitude glaciers." Consequently, they proceeded to do just that for the Archipelago of Svalbard, focusing on Spitsbergen (the Archipelago's main island) and the Longyearbreen glacier located in its relatively dry central region at 78°13'N latitude.
In reviewing what was already known about the region, Humlum et al. report that "a marked warming around 1920 changed the mean annual air temperature (MAAT) at sea level within only 5 years from about -9.5°C to -4.0°C," which change, in their words, "represents the most pronounced increase in MAAT documented anywhere in the world during the instrumental period." Then, they report that "from 1957 to 1968, MAAT dropped about 4°C, followed by a more gradual increase towards the end of the twentieth century."
With respect to the Longyearbreen glacier, their own work revealed that it had "increased in length from about 3 km to its present size of about 5 km during the last c. 1100 years," and they stated that "this example of late-Holocene glacier growth represents a widespread phenomenon in Svalbard and in adjoining Arctic regions," which they describe as a "development towards cooler conditions in the Arctic" that "may explain why the Little Ice Age glacier advance in Svalbard usually represents the Holocene maximum glacier extension."
As for what it all means, climate change in Svalbard over the 20th century appears to have been a real rollercoaster ride, with temperatures rising more rapidly in the early 1920s than has been documented anywhere else before or since, only to be followed by a nearly equivalent temperature drop four decades later, both of which transitions were totally out of line with what climate models suggest should have occurred. In addition, the current location of the terminus of the Longyearbreen glacier suggests that, even now, Svalbard and "adjoining Arctic regions" are still experiencing some of the lowest temperatures of the entire Holocene, and at a time when atmospheric CO2 concentrations are higher than they have likely been for millions of years, both of which observations are also at odds with what climate alarmists claim about the strong warming power of atmospheric CO2 enrichment. Hence, there is little reason to put much faith in their claims, or to get too excited if the Arctic were to warm a bit ... or even substantially and at a rapid rate. It's done so before, and it will likely do so again. In fact, it's only to be expected, seeing that the region has a long way to go to recover from some of the coldest temperatures of the entire interglacial in which we currently live.
In one final paper from 2005, Soon explores the question of what was the more dominant driver of 20th-century temperature change in the Arctic: the rising atmospheric CO2 concentration or variations in solar irradiance. This he did by examining the roles the two variables may have played in forcing decadal, multi-decadal and longer-term variations in surface air temperature (SAT). More specifically, he performed a number of statistical analyses on (1) a composite Arctic-wide SAT record constructed by Polyakov et al. (2003), (2) global CO2 concentrations taken from estimates made by the NASA GISS climate modeling group, and (3) a total solar irradiance (TSI) record developed by Hoyt and Schatten (1993, updated by Hoyt in 2005) over the period 1875-2000.
The results of Soon's analyses indicated a much stronger statistical relationship existed between SAT and TSI than between SAT and atmospheric CO2 concentration. In fact, solar forcing generally explained well over 75% of the variance in decadal-smoothed seasonal and annual Arctic temperatures, while CO2 forcing only explained between 8 and 22%. Wavelet analysis further supported the case for solar forcing of SAT, revealing similar time-frequency characteristics for annual and seasonally-averaged temperatures at decadal and multi-decadal time scales. In contrast, wavelet analysis gave little to no indication of a CO2 forcing of Arctic SSTs. Based on these findings, therefore, it would appear that it is the sun, and not atmospheric CO2, that has been driving temperature change in the Arctic over the 20th century.
Moving forward in once again, Hanna et al. (2006) developed a 119-year history of Icelandic Sea Surface Temperature (SST) based on measurements made at ten coastal stations located between latitudes 63°24'N and 66°32'N. This work revealed the existence of past "long-term variations and trends that are broadly similar to Icelandic air temperature records: that is, generally cold conditions during the late nineteenth and early twentieth centuries; strong warming in the 1920s, with peak SSTs typically being attained around 1940; and cooling thereafter until the 1970s, followed once again by warming -- but not generally back up to the level of the 1930s/1940s warm period." Consequently, although (a) climate alarmists have at different times claimed earth's mean global temperature is currently (1) higher than it has been for the past thousand years, (2) higher than it has been for the past two thousand years, (3) higher than it has been for the past twelve thousand years, as well as (4) almost as high as the highest temperature of the past million years, and although (b) global warming is claimed by climate alarmists to be (5) most strongly expressed and (6) earliest expressed in high northern latitudes, such has not been the case in the vicinity of Iceland, as it has also not the case in many places throughout the Arctic. In fact, one need only look back in time a mere seven decades or so to find modern Icelandic SSTs significantly eclipsed, which suggests there is something drastically wrong, not only with the climate-alarmist view of the future, but with the climate-alarmist view of the past.
More of the same was provided by Hansen et al. (2006), who analyzed meteorological data from Arctic Station (69°15'N, 53°31'W) on Disko Island (West Greenland) for the period 1991-2004, after which their results were correlated, in the words of the researchers, "to the longest record available from Greenland at Ilulissat/Jakobshavn (since 1873)." Once this was done, marked changes were noted over the course of the study period, including "increasing mean annual air temperatures on the order of 0.4°C per year and 50% decrease in sea ice cover." In addition, due to "a high correlation between mean monthly air temperatures at the two stations (1991-2004)," Hansen et al. were able to place the air temperature trend observed at Disko "in a 130 years perspective." This exercise led them to conclude that the climate changes of the last decade were "dramatic," but that "similar changes in air temperatures [had] occurred previous[ly] within the last 130 years." More specifically, they report that the changes they observed over the last decade "are on the same order as changes [that] occurred between 1920 and 1930."
In Iceland, Bradwell et al. (2006) examined the link between late Holocene fluctuations of Lambatungnajokull (an outlet glacier of the Vatnajokull ice cap of southeast Iceland) and variations in climate, using geomorphological evidence to reconstruct patterns of past glacier fluctuations and lichenometry and tephrostratigraphy to date glacial landforms created by the glacier over the past four centuries. This work revealed, in their words, that "there is a particularly close correspondence between summer air temperature and the rate of ice-front recession of Lambatungnajokull during periods of overall retreat," and that "between 1930 and 1950 this relationship is striking." They also report that "ice-front recession was greatest during the 1930s and 1940s, when retreat averaged 20 m per year." Thereafter, however, they say the retreat "slowed in the 1960s," and they report that "there has been little overall retreat since the 1980s." The researchers also report that "the 20th-century record of reconstructed glacier-front fluctuations at Lambatungnajokull compares well with those of other similar-sized, non-surging, outlets of southern Vatnajokull," including Skaftafellsjokull, Fjallsjokull, Skalafellsjokull and Flaajokull. In fact, they find that "the pattern of glacier fluctuations of Lambatungnajokull over the past 200 years reflects the climatic changes that have occurred in southeast Iceland and the wider region."
Bradwell et al.'s findings thus indicate that 20th-century summer air temperature in southeast Iceland and the wider region peaked in the 1930s and 1940s, and that this warming was followed by a cooling that persisted through the end of the century. This thermal behavior is about as different as one could possibly imagine from the climate-alarmist claim that the warming of the globe over the last two decades of the 20th century was unprecedented over the past two millennia; and especially is this so for a high-northern-latitude region, where climate alarmists claim CO2-induced global warming should be earliest and most strongly expressed.
Contemporaneously, Drinkwater (2006) decided "to provide a review of the changes to the marine ecosystems of the northern North Atlantic during the 1920s and 1930s and to discuss them in the light of contemporary ideas of regime shifts," where he defined regime shift as "a persistent radical shift in typical levels of abundance or productivity of multiple important components of the marine biological community structure, occurring at multiple trophic levels and on a geographical scale that is at least regional in extent." As a prologue to this effort, he first determined that "in the 1920s and 1930s, there was a dramatic warming of the air and ocean temperatures in the northern North Atlantic and the high Arctic, with the largest changes occurring north of 60°N," which warming "led to reduced ice cover in the Arctic and subarctic regions and higher sea temperatures," as well as northward shifts of multiple marine ecosystems. This change in climate occurred "during the 1920s, and especially after 1925," according to Drinkwater, when he reports that "average air temperatures began to rise rapidly and continued to do so through the 1930s," when "mean annual air temperatures increased by approximately 0.5-1°C and the cumulative sums of anomalies varied from 1.5 to 6°C between 1920 and 1940 with the higher values occurring in West Greenland and Iceland." Thereafter, as he describes it, "through the 1940s and 1950s air temperatures in the northernmost regions varied but generally remained relatively high," declining in the late 1960s in the northwest Atlantic and slightly earlier in the northeast Atlantic, which cooling has only recently begun to be reversed in certain parts of the region.
In the realm of biology, the early 20th-century warming of North Atlantic waters "contributed to higher primary and secondary production," in the words of Drinkwater, and "with the reduced extent of ice-covered waters, more open water allow[ed] for higher production than in the colder periods." As a result, cod "spread approximately 1200 km northward along West Greenland," and "migration of 'warmer water' species also changed with earlier arrivals and later departures." In addition, Drinkwater notes that "new spawning sites were observed farther north for several species or stocks while for others the relative contribution from northern spawning sites increased." Also, he writes that "some southern species of fish that were unknown in northern areas prior to the warming event became occasional, and in some cases, frequent visitors." Consequently, and considering all aspects of the event, Drinkwater states that "the warming in the 1920s and 1930s is considered to constitute the most significant regime shift experienced in the North Atlantic in the 20th century."
Last of all, in the words of Groisman et al. (2006), "a new Global Synoptic Data Network consisting of 2100 stations within the boundaries of the former Soviet Union created jointly by the [U.S.] National Climatic Data Center and Russian Institute for Hydrometeorological Information was used to assess the climatology of snow cover, frozen and unfrozen ground reports, and their temporal variability for the period from 1936 to 2004." In carrying out this work, they determined that "during the past 69 years (1936-2004 period), an increase in duration of the period with snow on the ground over Russia and the Russian polar region north of the Arctic circle has been documented by 5 days or 3% and 12 days or 5%, respectively," and they note that this result "is in agreement with other findings."
In commenting on this development, plus the similar findings of others, the five researchers say that "changes in snow cover extent during the 1936-2004 period cannot [our italics] be linked with 'warming' (particularly with the Arctic warming)." And why? Because, as they continue, "in this particular period the Arctic warming was absent."
These facts are particularly enlightening, because approximately 70% of the atmospheric CO2 increase experienced since the dawn of the Industrial Revolution occurred between 1934 and 2004, yet over this time period, and throughout the part of the planet where climate models predict CO2-induced global warming should be both strongest and most evident (the Arctic), there was no warming, CO2-induced or otherwise, which means that the lion's share of the Arctic warming of the past century or more occurred in concert with the initial 30% increase in the atmosphere's CO2 concentration; yet this is the period during which climate alarmists generally attribute most of the warming that occurred to natural causes, and if this is true, it suggests that the Arctic has experienced little CO2-induced warming throughout any of the period during which the earth was recovering from the naturally-induced Little Ice Age, which leaves us with little reason to worry about anthropogenic CO2 emissions, as they appear to have had next to no impact on the climate of the most sensitive part of the planet throughout historic time.
In concluding this review of Arctic temperatures, we end with a short synopsis of a brief communication from Karlen (2005), wherein he asks if temperatures in the Arctic are "really rising at an alarming rate," as the world's climate alarmists claim they are. His short answer is a resounding no; his explanation follows.
Focusing on Svalbard Lufthavn (located at 78°N latitude), which he later shows to be representative of much of the Arctic, Karlen reports that "the Svalbard mean annual temperature increased rapidly from the 1910s to the late 1930s," that "the temperature thereafter became lower, and a minimum was reached around 1970," and that "Svalbard thereafter became warmer, but the mean temperature in the late 1990s was still slightly cooler than it was in the late 1930s," indicative of an actual cooling trend of 0.11°C per decade over the last seventy years of the 20th century.
In support of his contention that cooling was truly the norm in the Arctic over this period, Karlen goes on to state that (1) "the observed warming during the 1930s is supported by data from several stations along the Arctic coasts and on islands in the Arctic, e.g. Nordklim data from Bjornoya and Jan Mayen in the north Atlantic, Vardo and Tromso in northern Norway, Sodankylaeand Karasjoki in northern Finland, and Stykkisholmur in Iceland," and that (2) "there is also [similar] data from other reports; e.g. Godthaab, Jakobshavn, and Egedesmindde in Greenland, Ostrov Dikson on the north coast of Siberia, Salehard in inland Siberia, and Nome in western Alaska." All of these stations, to quote him further, "indicate the same pattern of changes in annual mean temperature: a warm 1930s, a cooling until around 1970, and thereafter a warming, although the temperature remains slightly below the level of the late 1930s [our italics]." In addition, he says that "many stations with records starting later than the 1930s also indicate cooling, e.g. Vize in the Arctic Sea north of the Siberian coast and Frobisher Bay and Clyde on Baffin Island." Last of all, Karlen reports that the 250-year temperature record of Stockholm "shows that the fluctuations of the 1900s are not unique," and that "changes of the same magnitude as in the 1900s occurred between 1770 and 1800, and distinct but smaller fluctuations occurred around 1825."
Noting that the IPCC suggests that the lion's share of the temperature increase during the 1920s and into the 1930s (which in the Arctic was the most dramatic warming of the 20th century) was primarily due to solar effects (because the increase in CO2 over this period was so small they had to go with something else), Karlen next notes that subsequently, "during the 50 years in which the atmospheric concentration of CO2 has increased considerably, the temperature has decreased [our italics]," which leads him to conclude that "the Arctic temperature data do not support the models predicting that there will be a critical future warming of the climate because of an increased concentration of CO2 in the atmosphere." And especially is this so when it is remembered, in Karlen's words, that the model-based prediction "is that changes will be strongest and first noticeable in the Arctic."
Consequently, seeing that the first and only period of net warming in the Arctic occurred at a time when CO2 could not possibly have been its cause, it should be clear to all that the modern theory of CO2-induced global warming is a totally unreliable guide to the future.
References
Benner, R., Benitez-Nelson, B., Kaiser, K. and Amon, R.M.W. 2004. Export of young terrigenous dissolved organic carbon from rivers to the Arctic Ocean. Geophysical Research Letters 31: 10.1029/2003GL019251.
Bradwell, T., Dugmore, A.J. and Sugden, D.E. 2006. The Little Ice Age glacier maximum in Iceland and the North Atlantic Oscillation: evidence from Lambatungnajokull, southeast Iceland. Boreas 35: 61-80.
Briffa, K.R., Osborn, T.J. and Schweingruber, F.H. 2004. Large-scale temperature inferences from tree rings: a review. Global and Planetary Change 40: 11-26.
Briffa, K.R., Schweingruber, F.H., Jones, P.D., Osborn, T.J., Shiyatov, S.G. and Vaganov, E.A. 1998. Reduced sensitivity of recent tree-growth to temperature at high northern latitudes. Nature 391: 678-682.
Chylek, P., Box, J.E. and Lesins, G. 2004. Global warming and the Greenland ice sheet. Climatic Change 63: 201-221.
Comiso, J.C. 2000. Variability and trends in Antarctic surface temperatures from in situ and satellite infrared measurements. Journal of Climate 13: 1674-1696.
Comiso, J.C., Wadhams, P., Pedersen, L.T. and Gersten, R.A. 2001. Seasonal and interannual variability of the Odden ice tongue and a study of environmental effects. Journal of Geophysical Research 106: 9093-9116.
Deser, C., Walsh, J.E. and Timlin, M.S. 2000. Arctic sea ice variability in the context of recent atmospheric circulation trends. Journal of Climatology 13: 617-633.
Doran, P.T., Priscu, J.C., Lyons, W.B., Walsh, J.E., Fountain, A.G., McKnight, D.M., Moorhead, D.L., Virginia, R.A., Wall, D.H., Clow, G.D., Fritsen, C.H., McKay, C.P. and Parsons, A.N. 2002. Antarctic climate cooling and terrestrial ecosystem response. Nature (DOI 10.1038/nature710).
Drinkwater, K.F. 2006. The regime shift of the 1920s and 1930s in the North Atlantic. Progress in Oceanography 68: 134-151.
Esper, J., Cook, E.R. and Schweingruber, F.H. 2002. Low-frequency signals in long tree-ring chronologies for reconstructing past temperature variability. Science 295: 2250-2253.
Gedalof, Z. and Smith, D.J. 2001. Interdecadal climate variability and regime-scale shifts in Pacific North America. Geophysical Research Letters 28: 1515-1518.
Gonzalez-Rouco, F., von Storch, H. and Zorita, E. 2003. Deep soil temperature as proxy for surface air-temperature in a coupled model simulation of the last thousand years. Geophysical Research Letters 30: 10.1029/2003GL018264.
Goulden, M.L., Wofsy, S. C., Harden, J.W., Trumbore, S.E., Crill, P.M., Gower, S.T., Fries, T., Daube, B.C., Fan, S., Sutton, D.J., Bazzaz, A. and Munger, J.W. 1998. Sensitivity of boreal forest carbon balance to soil thaw. Science 279: 214-217.
Groisman, P.Ya., Knight, R.W., Razuvaev, V.N., Bulygina, O.N. and Karl, T.R. 2006. State of the ground: Climatology and changes during the past 69 years over northern Eurasia for a rarely used measure of snow cover and frozen land. Journal of Climate 19: 4933-4955.
Hanna, E. and Cappelen, J. 2002. Recent climate of Southern Greenland. Weather 57: 320-328.
Hanna, E. and Cappelen, J. 2003. Recent cooling in coastal southern Greenland and relation with the North Atlantic Oscillation. Geophysical Research Letters 30: 10.1029/2002GL015797.
Hanna, E., Jonsson, T., Olafsson, J. and Valdimarsson, H. 2006. Icelandic coastal sea surface temperature records constructed: Putting the pulse on air-sea-climate interactions in the Northern North Atlantic. Part I: Comparison with HadISST1 open-ocean surface temperatures and preliminary analysis of long-term patterns and anomalies of SSTs around Iceland. Journal of Climate 19: 5652-5666.
Hansen, B.U., Elberling, B., Humlum, O. and Nielsen, N. 2006. Meteorological trends (1991-2004) at Arctic Station, Central West Greenland (69°15'N) in a 130 years perspective. Geografisk Tidsskrift, Danish Journal of Geography 106: 45-55.
Heide-Jorgensen, M.P., Richard, P., Ramsay, M. and Akeeagok, S. 2002. In: Three Recent Ice Entrapments of Arctic Cetaceans in West Greenland and the Eastern Canadian High Arctic. Volume 4, NAMMCO Scientific Publications, pp. 143-148.
Hoyt, D.V. and Schatten, K.H. 1993. A discussion of plausible solar irradiance variations, 1700-1992. Journal of Geophysical Research 98: 18,895-18,906.
Humlum O. 1999. Late-Holocene climate in central West Greenland: meteorological data and rock-glacier isotope evidence. The Holocene 9: 581-594.
Humlum, O., Elberling, B., Hormes, A., Fjordheim, K., Hansen, O.H. and Heinemeier, J. 2005. Late-Holocene glacier growth in Svalbard, documented by subglacial relict vegetation and living soil microbes. The Holocene 15: 396-407.
Isaksson, E., Hermanson, M., Hicks, S., Igarashi, M., Kamiyama, K., Moore, J., Motoyama, H., Muir, D., Pohjola, V., Vaikmae, R., van de Wal, R.S.W. and Watanabe, O. 2003. Ice cores from Svalbard - useful archives of past climate and pollution history. Physics and Chemistry of the Earth 28: 1217-1228.
Karlen, W. 2005. Recent global warming: An artifact of a too-short temperature record? Ambio 34: 263-264.
Kasper, J.N. and Allard, M. 2001. Late-Holocene climatic changes as detected by the growth and decay of ice wedges on the southern shore of Hudson Strait, northern Québec, Canada. The Holocene 11: 563-577.
Knudsen, K.L., Eiriksson, J., Jansen, E., Jiang, H., Rytter, F. and Gudmundsdottir, E.R. 2004. Palaeoceanographic changes off North Iceland through the last 1200 years: foraminifera, stable isotopes, diatoms and ice rafted debris. Quaternary Science Reviews 23: 2231-2246.
Laidre, K.L. and Heide-Jorgensen, M.P. 2005. Arctic sea ice trends and narwhal vulnerability. Biological Conservation 121: 509-517.
Lovelius, N.V. 1997. Dendroindication of Natural Processes. World and Family-95. St. Petersburg, Russia.
Mann, M.E., Bradley, R.S. and Hughes, M.K. 1998. Global-scale temperature patterns and climate forcing over the past six centuries. Nature 392: 779-787.
Mann, M.E., Bradley, R.S. and Hughes, M.K. 1999. Northern Hemisphere temperatures during the past millennium: Inferences, uncertainties, and limitations. Geophysical Research Letters 26: 759-762.
Mann, M.E. and Jones, P.D. 2003. Global surface temperatures over the past two millennia. Geophysical Research Letters 30: 10.1029/2003GL017814.
Meadows, D.H. 2001. Polar bears and 3-year-olds on thin ice. AlterNet.org. Posted 6 February 2001.
Moore, G.W.K., Holdsworth, G. and Alverson, K. 2002. Climate change in the North Pacific region over the past three centuries. Nature 420: 401-403.
Moore, J.J., Hughen, K.A., Miller, G.H. and Overpeck, J.T. 2001. Little Ice Age recorded in summer temperature reconstruction from varved sediments of Donard Lake, Baffin Island, Canada. Journal of Paleolimnology 25: 503-517.
Naurzbaev, M.M. and Vaganov, E.A. 2000. Variation of early summer and annual temperature in east Taymir and Putoran (Siberia) over the last two millennia inferred from tree rings. Journal of Geophysical Research 105: 7317-7326.
Naurzbaev, M.M., Vaganov, E.A., Sidorova, O.V. and Schweingruber, F.H. 2002. Summer temperatures in eastern Taimyr inferred from a 2427-year late-Holocene tree-ring chronology and earlier floating series. The Holocene 12: 727-736.
Overpeck, J., Hughen, K., Hardy, D., Bradley, R., Case, R., Douglas, M., Finney, B., Gajewski, K., Jacoby, G., Jennings, A., Lamoureux, S., Lasca, A., MacDonald, G., Moore, J., Retelle, M., Smith, S., Wolfe, A. and Zielinski, G. 1997. Arctic environmental change of the last four centuries. Science 278: 1251-1256.
Parkinson, C.L. 2000a. Variability of Arctic sea ice: the view from space, and 18-year record. Arctic 53: 341-358.
Parkinson, C.L. 2000b. Recent trend reversals in Arctic Sea ice extents: possible connections to the North Atlantic oscillation. Polar Geography 24: 1-12.
Parkinson, C.L. and Cavalieri, D.J. 2002. A 21-year record of Arctic sea-ice extents and their regional, seasonal and monthly variability and trends. Annals of Glaciology 34: 441-446.
Parkinson, C., Cavalieri, D., Gloersen, D., Zwally, J. and Comiso, J. 1999. Arctic sea ice extents, areas, and trends, 1978-1996. Journal of Geophysical Research 104: 20,837-20,856.
Peterson, B.J., Holmes, R.M., McClelland, J.W., Vorosmarty, C.J., Lammers, R.B., Shiklomanov, A.I., Shiklomanov, I.A. and Rahmstorf, S. 2002. Increasing river discharge in the Arctic Ocean. Science 298: 2171-2173.
Polyakov, I., Akasofu, S.-I., Bhatt, U., Colony, R., Ikeda, M., Makshtas, A., Swingley, C., Walsh, D. and Walsh, J. 2002a. Trends and variations in Arctic climate system. EOS, Transactions, American Geophysical Union 83: 547-548.
Polyakov, I.V., Alekseev, G.V., Bekryaev, R.V., Bhatt, U., Colony, R.L., Johnson, M.A., Karklin, V.P., Makshtas, A.P., Walsh, D. and Yulin A.V. 2002b. Observationally based assessment of polar amplification of global warming. Geophysical Research Letters 29: 10.1029/2001GL011111.
Polyakov, I.V., Alekseev, G.V., Timokhov, L.A., Bhatt, U.S., Colony, R.L., Simmons, H.L., Walsh, D., Walsh, J.E. and Zakharov, V.F. 2004. Variability of the intermediate Atlantic water of the Arctic Ocean over the last 100 years. Journal of Climate 17: 4485-4497.
Polyakov, I.V., Bekryaev, R.V., Alekseev, G.V., Bhatt, U.S., Colony, R.L., Johnson, M.A., Maskshtas, A.P. and Walsh, D. 2003. Variability and trends of air temperature and pressure in the maritime Arctic, 1875-2000. Journal of Climate 16: 2067-2077.
Przybylak, R. 1997. Spatial and temporal changes in extreme air temperatures in the Arctic over the period 1951-1990. International Journal of Climatology 17: 615-634.
Przybylak, R. 2000. Temporal and spatial variation of surface air temperature over the period of instrumental observations in the Arctic. International Journal of Climatology 20: 587-614.
Przybylak, R. 2002. Changes in seasonal and annual high-frequency air temperature variability in the Arctic from 1951-1990. International Journal of Climatology 22: 1017-1032.
Raspopov, O.M., Dergachev, V.A. and Kolstrom, T. 2004. Periodicity of climate conditions and solar variability derived from dendrochronological and other palaeoclimatic data in high latitudes. Palaeogeography, Palaeoclimatology, Palaeoecology 209: 127-139.
Schell, D.M. 1983. Carbon-13 and carbon-14 abundances in Alaskan aquatic organisms: Delayed production from peat in Arctic food webs. Science 219: 1068-1071.
Schirrmeister, L., Siegert, C., Kuznetsova, T., Kuzmina, S., Andreev, A., Kienast, F., Meyer, H. and Bobrov, A. 2002. Paleoenvironmental and paleoclimatic records from permafrost deposits in the Arctic region of northern Siberia. Quaternary International 89: 97-118.
Schweingruber, F.H. and Briffa, K.R. 1996. Tree-ring density network and climate reconstruction. In: Jones, P.D., Bradley, R.S. and Jouzel, J. (Eds.), Climatic Variations and Forcing Mechanisms of the Last 2000 Years, NATO ASI Series 141. Springer-Verlag, Berlin, Germany, pp. 43-66.
Siegstad, H. and Heide-Jorgensen, M.P. 1994. Ice entrapments of narwhals (Monodon monoceros) and white whales (Delphinapterus leucas) in Greenland. Meddeleser om Gronland Bioscience 39: 151-160.
Soon, W. W.-H. 2005. Variable solar irradiance as a plausible agent for multidecadal variations in the Arctic-wide surface air temperature record of the past 130 years. Geophysical Research Letters 32 L16712, doi:10.1029/2005GL023429.
Steig, E.J., Grootes, P.M. and Stuiver, M. 1994. Seasonal precipitation timing and ice core records. Science 266: 1885-1886.
Stern, H.L. and Heide-Jorgensen, M.P. 2003. Trends and variability of sea ice in Baffin Bay and Davis Strait, 1953-2001. Polar Research 22: 11-18.
Stuiver, M., Grootes, P.M. and Braziunas, T.F. 1995. The GISP2 18O climate record of the past 16,500 years and the role of the sun, ocean and volcanoes. Quaternary Research 44: 341-354.
Taurisano, A., Boggild, C.E. and Karlsen, H.G. 2004. A century of climate variability and climate gradients from coast to ice sheet in West Greenland. Geografiska Annaler 86A: 217-224.
Thompson, D.W.J. and Solomon, S. 2002. Interpretation of recent Southern Hemisphere climate change. Science 296: 895-899.
Treshnikov, A.F. (Ed.). 1985. Atlas Arktiki. Glavnoye Upravlenye Geodeziy i Kartografiy, Moskva.
Vaganov, E.A., Briffa, K.R., Naurzbaev, M.M., Schweingruber, F.H., Shiyatov, S.G. and Shishov, V.V. 2000. Long-term climatic changes in the arctic region of the Northern Hemisphere. Doklady Earth Sciences 375: 1314-1317.
Vaganov, E.A., Shiyatov, S.G. and Mazepa,V.S. 1996. Dendroclimatic Study in Ural-Siberian Subarctic. Nauka, Novosibirsk, Russia.
White, J.W.C., Barlow, L.K., Fisher, D., Grootes, P.M., Jouzel, J., Johnsen, S.J., Stuiver, M. and Clausen, H.B. 1997. The climate signal in the stable isotopes of snow from Summit, Greenland: Results of comparisons with modern climate observations. Journal of Geophysical Research 102: 26,425-26,439.
Yoo, JC. and D'Odorico, P. 2002. Trends and fluctuations in the dates of ice break-up of lakes and rivers in Northern Europe: the effect of the North Atlantic Oscillation. Journal of Hydrology 268: 100-112.
Zeeberg, J. and Forman, S.L. 2001. Changes in glacier extent on north Novaya Zemlya in the twentieth century. Holocene 11: 161-175.
Last updated 29 April 2009