


Carbon Dioxide and Earth's Future: Pursuing the Prudent Path
1. Unprecedented Warming of the Planet
The claim: With respect to air temperature, the climate-alarmist contention is multifaceted. It is claimed that over the past several decades: (a) earth's temperature has risen to a level that is unprecedented over the past millennium or more, (b) the world has been warming at a rate that is equally unprecedented, and (c) both of these dubious achievements have been made possible by the similarly unprecedented magnitude of anthropogenic CO2 emissions, due to humanity's ever-increasing burning of fossil fuels such as coal, gas and oil.
With respect to the level of warmth the earth has recently attained, it is important to see how it compares with prior temperatures experienced by the planet, in order to determine the degree of "unprecedentedness" of its current warmth.
Taking a rather lengthy view of the subject, Petit et al. (1999) found that peak temperatures experienced during the current interglacial, or Holocene, have been the coldest of the last five interglacials, with the four interglacials that preceded the Holocene being, on average, more than 2°C warmer (see figure at right). And in a more recent analysis of the subject, Sime et al. (2009) suggested that the "maximum interglacial temperatures over the past 340,000 years were between 6.0°C and 10.0°C above present-day values." If anything, therefore, these findings suggest that temperatures of the Holocene, or current interglacial, were indeed unusual, but not unusually warm. Quite to the contrary, they have been unusually cool.
Proxy temperature anomalies derived by Petit et al. (1999) from the Vostok ice core in Antarctica.
But could the higher temperatures of the past four interglacials have been caused by higher CO2 concentrations due to some non-human influence? Absolutely not, for atmospheric CO2 concentrations during all four prior interglacials never rose above approximately 290 ppm, whereas the air's CO2 concentration today stands at nearly 390 ppm.
Combining these two observations, we have a situation where, compared with the mean conditions of the preceding four interglacials, there is currently 100 ppm more CO2 in the air than there was then, and it is currently more than 2°C colder than it was then, which adds up to one huge discrepancy for the world's climate alarmists and their claim that high atmospheric CO2 concentrations lead to high temperatures. The situation is unprecedented, all right, but not in the way the public is being led to believe.
Zooming in a little closer to the present, we compare earth's modern temperatures with those of the past 1000 years, where the IPCC bases its claim for recent heretofore-unreached high temperatures on the infamous "hockey stick" temperature history of Mann et al. (1998, 1999). There is a problem with this history, however, in that reconstructed temperatures derived from a variety of proxy data (which make up the bulk of the temperature history) are replaced near its end with the historical record of directly-measured temperatures, resulting in an "apples vs. oranges" type of comparison, where the latter cannot be validly compared with the former, because the two types of data are not derived in the same way and are, therefore, not perfectly compatible with each other.
In addition, subsequent evidence indicated that the reconstructed temperatures of some regions did not rise as dramatically as their directly-measured values did over the latter part of the 20th century (Cook et al., 2004), demonstrating the importance of the problem and suggesting that if there had been any directly-measured temperatures during the earlier part of the past millennium, they may also have been higher than the reconstructed temperatures of that period. Therefore, due to this divergence problem, as D'Arrigo et al. (2008) have described it, reconstructions based on tree-ring data from certain regions "cannot be used to directly compare past natural warm periods (notably, the Medieval Warm Period) with recent 20th century warming, making it more difficult to state unequivocally that the recent warming is unprecedented."
In a much improved method of temperature reconstruction based on tree-ring analysis, Esper et al. (2002) employed an analytical technique that allows accurate long-term climatic trends to be derived from individual tree-ring series that are of much shorter duration than the potential climatic oscillation being studied; and they applied this technique to over 1200 individual tree-ring series derived from fourteen different locations scattered across the extratropical region of the Northern Hemisphere. This work revealed, as they describe it, that "past comparisons of the Medieval Warm Period with the 20th-century warming back to the year 1000 have not included all of the Medieval Warm Period and, perhaps, not even its warmest interval." And in further commenting on this important finding, Briffa and Osborn (2002) revealed that "an early period of warmth in the late 10th and early 11th centuries is more pronounced than in previous large-scale reconstructions." In addition, the Esper et al. record made it abundantly clear that the peak warmth of the Medieval Warm Period was fully equivalent to the warmth of the present.
In another important study, von Storch et al. (2004) demonstrated that past variations in real-world temperature "may have been at least a factor of two larger than indicated by empirical reconstructions," and in commenting on their findings, Osborn and Briffa (2004) stated that "if the true natural variability of Northern Hemisphere temperature is indeed greater than is currently accepted," which they appeared to suggest is likely the case, "the extent to which recent warming can be viewed as 'unusual' would need to be reassessed." And more recently, Mann et al. (2009) have had to admit that even using the "apples vs. oranges" approach, the warmth over a large part of the North Atlantic, Southern Greenland, the Eurasian Arctic, and parts of North America during the Medieval Warm Period was "comparable to or exceeds that of the past one-to-two decades in some regions."
So what happens when reconstructed temperature data are employed all the way from the beginning to the end of the past millennium or so? In the data section of our website (www.co2science.org), within what we call our Medieval Warm Period Project, we report the results of a new and properly-prepared millennial temperature reconstruction for a different part of the globe every single week. Some of these studies allow actual numerical values of reconstructed temperature differentials between the peak warmth of the Medieval Warm Period (MWP) and the peak warmth of the Current Warm Period (CWP) to be determined, while others merely enable one to determine which of these periods was the warmer of the two.
The results of these two sets of analyses are depicted in the two figures below, representing many more locations than were employed by Mann et al. in deriving their original "hockey stick" graph.

The distribution, in 0.5°C increments, of studies that allow one to identify the degree by which peak Medieval Warm Period temperatures either exceeded (positive values, red) or fell short of (negative values, blue) peak Current Warm Period temperatures.

The distribution of studies that allow one to determine whether peak Medieval Warm Period temperatures were warmer than (red), equivalent to (green), or cooler than (blue), peak Current Warm Period temperatures. These studies do not include those of the preceding figure, the blue ones of which should be added to the blue ones of this figure, and the red ones of which should be added to the red ones of this figure, if true totals of these two result categories are desired.
The story told by the two figures above seems pretty clear: the peak warmth of the MWP was typically, but not universally, greater than the peak warmth of the CWP has been to date. And that earlier period of greater warmth occurred at a time when the atmosphere's CO2 concentration was fully 100 ppm less than it is today, indicative of the fact that the earth has experienced equivalent or warmer temperatures than those of the present when there was much less CO2 in the air, which suggests that whatever was responsible for the greater warmth of the MWP could easily be responsible for the lesser warmth of the CWP.
In discussing one final large-scale study that did not mix apples and oranges between its early and later stages, Ljungqvist (2010) developed a 2000-year temperature history of the extra-tropical portion of the Northern Hemisphere (i.e., that part covering the latitudinal range 30-90°N) based on 30 temperature-sensitive proxy records with annual to multi-decadal resolution, including two historical documentary records, three marine sediment records, five lake sediment records, three speleothem δ18O records, two ice-core δ18O records, four varved thickness sediment records, five tree-ring width records, five tree-ring maximum latewood density records, and one δ13C tree-ring record, but not including tree-ring width records from arid and semi-arid regions, since they may have been affected by drought stress, and they may not show a linear response to warming if higher summer temperatures also reduce the availability of water, as suggested by the work of D'Arrigo et al. (2006) and Loehle (2009).
The results of Ljungqvist's stellar efforts are depicted in the following figure.
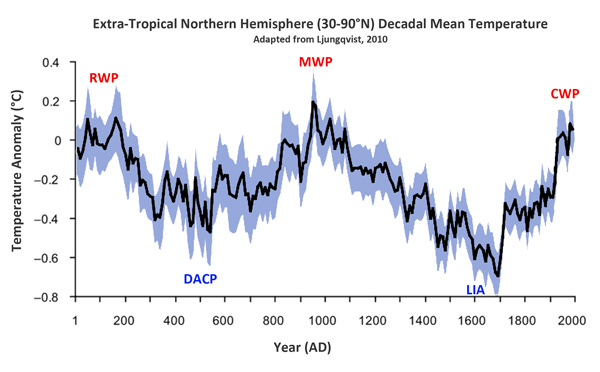 Reconstructed extra-tropical (30-90°N) mean decadal temperature variations relative to the 1961-1990 mean of the variance-adjusted 30-90°N CRUTEM3+HadSST2 instrumental temperature data of Brohan et al. (2006) and Rayner et al. (2006), showing the approximate locations of the Roman Warm Period (RWP), Dark Ages Cold Period (DACP), Medieval Warm Period (MWP), Little Ice Age (LIA) and Current Warm Period (CEP). Adapted from Ljungqvist (2010).
In discussing this temperature history, Ljungqvist states that it depicts "a Roman Warm Period c. AD 1-300, a Dark Age Cold Period c. AD 300-800, a Medieval Warm Period c. AD 800-1300 and a Little Ice Age c. AD 1300-1900, followed by the twentieth-century warming." These alternating warm/cold periods, in his words, "probably represent the much discussed quasi-cyclical c. 1470 +/- 500-year Bond Cycles (Bond and Lotti, 1995; O'Brien et al., 1995; Bond et al., 1997, 2001; Oppo, 1997)," which "affected both Scandinavia and northwest North America synchronically (Denton and Karlen, 1973)" and have "subsequently also been observed in China (Hong et al., 2009a,b), the mid-latitude North Pacific (Isono et al., 2009) and in North America (Viau et al., 2006), and have been shown to very likely have affected the whole Northern Hemisphere during the Holocene (Butikofer, 2007; Wanner et al., 2008; Wanner and Butikofer, 2008), or even been global (Mayewski et al., 2004)."
Ljungqvist also notes that "decadal mean temperatures in the extra-tropical Northern Hemisphere seem to have equaled or exceeded the AD 1961-1990 mean temperature level during much of the Roman Warm Period and the Medieval Warm Period," and he says that "the second century, during the Roman Warm Period, is the warmest century during the last two millennia," while adding that "the highest average temperatures in the reconstruction are encountered in the mid to late tenth century," which was during the Medieval Warm Period. He warns, however, that the temperature of the last two decades "is possibly higher than during any previous time in the past two millennia," but adds that "this is only seen in the instrumental temperature data and not in the multi-proxy reconstruction itself," which is akin to saying that this possibility only presents itself if one applies Michael Mann's "Nature trick" of comparing "apples and oranges," which is clearly not valid, as discussed earlier in this report.
This new study of Ljungqvist is especially important in that it utilizes, in his words, "a larger number of proxy records than most previous reconstructions," and because it "substantiates an already established history of long-term temperature variability." All of these facts, taken together, clearly demonstrate that there is nothing unusual, nothing unnatural or nothing unprecedented about the planet's current level of warmth, seeing it was just as warm as, or even warmer than, it has been recently during both the Roman and Medieval Warm Periods, when the atmosphere's CO2 concentration was more than 100 ppm less than it is today. And this latter observation, together with the realization that earth's climate naturally transits back and forth between cooler and warmer conditions on a millennial timescale, demonstrates that there is absolutely no need to associate the planet's current level of warmth with its current higher atmospheric CO2 concentration, in clear contradiction of the worn-out climate-alarmist claim that the only way to explain earth's current warmth is to associate it with the greenhouse effect of CO2. That claim -- for which there is no supporting evidence, other than misplaced trust in climate models -- is unsound.
With respect to the recent rate at which the earth has warmed, we examine the results of a number of studies that have investigated recent temperature changes in the Arctic, which Meadows (2001) described as "the place to watch for global warming, the sensitive point, the canary in the coal mine." Here, in comparing the vast array of prior Holocene climate changes with what climate alarmists claim to be the "unprecedented" anthropogenic-induced warming of the past several decades, White et al. (2010) recently determined that "the human influence on rate and size of climate change thus far does not stand out strongly from other causes of climate change."
Other scientists preceded White et al. with similar conclusions. Chylek et al. (2006) studied two century-long temperature records from southern coastal Greenland -- Godthab Nuuk on the west and Ammassalik on the east -- both of which are close to 64°N latitude, concentrating on the period 1915-2005. And in doing so, as they describe it, they determined that "two periods of intense warming (1995-2005 and 1920-1930) are clearly visible in the Godthab Nuuk and Ammassalik temperature records." However, they state that "the average rate of warming was considerably higher within the 1920-1930 decade than within the 1995-2005 decade." In fact, they report that the earlier warming rate was 50% greater than the most recent one. And in discussing this fact, they say that "an important question is to what extent can the current (1995-2005) temperature increase in Greenland coastal regions be interpreted as evidence of man-induced global warming?" In providing their own answer, they noted that "the Greenland warming of 1920 to 1930 demonstrates that a high concentration of carbon dioxide and other greenhouse gases is not a necessary condition for [a] period of warming to arise," and that "the observed 1995-2005 temperature increase seems to be within [the] natural variability of Greenland climate."
A similar study was conducted two years later by Mernild et al. (2008), who described "the climate and observed climatic variations and trends in the Mittivakkat Glacier catchment in Low Arctic East Greenland from 1993 to 2005 ... based on the period of detailed observations (1993-2005) and supported by synoptic meteorological data from the nearby town of Tasiilaq (Ammassalik) from 1898 to 2004." This work revealed that "the Mittivakkat Glacier net mass balance has been almost continuously negative, corresponding to an average loss of glacier volume of 0.4% per year." And during the past century of general mass loss, they found that "periods of warming were observed from 1918 (the end of the Little Ice Age) to 1935 of 0.12°C per year and 1978 to 2004 of 0.07°C per year," with the former rate of warming being fully 70% greater than the most recent rate of warming.
Last of all, Wood et al. (2010) constructed a two-century (1802-2009) instrumental record of annual surface air temperature within the Atlantic-Arctic boundary region, using data obtained from recently published (Klingbjer and Moberg, 2003; Vinther et al., 2006) and historical (Wahlen, 1886) sources that yielded four station-based composite time series that pertain to Southwestern Greenland, Iceland, Tornedalen (Sweden) and Arkhangel'sk (Russia). This operation added seventy-six years to the previously available record, the credibility of which result, in Wood et al.'s words, "is supported by ice core records, other temperature proxies, and historical evidence." And the U.S. and Icelandic researchers determined that their newly extended temperature history and their analysis of it revealed "an irregular pattern of decadal-scale temperature fluctuations over the past two centuries," of which the early twentieth-century warming (ETCW) event -- which they say "began about 1920 and persisted until mid-century" -- was by far "the most striking historical example."
In further discussing their findings, Wood et al. write that "as for the future, with no other examples in the record quite like the ETCW, we cannot easily suggest how often -- much less when -- such a comparably large regional climate fluctuation might be expected to appear." Nevertheless, they say that if past is prologue to the future, "it would be reasonable to expect substantial regional climate fluctuations of either sign to appear from time to time," and, therefore, that "singular episodes of regional climate fluctuation should be anticipated in the future," which also implies that any rapid warming that may subsequently occur within the Atlantic-Arctic boundary region need not be due to rising greenhouse gas concentrations, as it could well be caused by the same unknown factor that caused the remarkable ETCW event, which further implies that the Arctic is not the "canary in the coal mine" that climate alarmists make it out to be.
With respect to the cause of earth's recent warming, we note that the truly unprecedented and increasing magnitude of anthropogenic CO2 emissions over the past few decades has not resulted in any similar increase in the rate of Arctic warming. Looking first at three coastal stations in southern and central Greenland that possess almost uninterrupted temperature records between 1950 and 2000, for example, Chylek et al. (2004) discovered that "summer temperatures, which are most relevant to Greenland ice sheet melting rates, do not show any persistent increase during the last fifty years." In fact, working with the two stations with the longest records (both over a century in length), they determined that coastal Greenland's peak temperatures occurred between 1930 and 1940, and that the subsequent decrease in temperature was so substantial and sustained that then-current coastal temperatures were "about 1°C below their 1940 values." Furthermore, they noted that at the summit of the Greenland ice sheet the summer average temperature had "decreased at the rate of 2.2°C per decade since the beginning of the measurements in 1987." Thus, as with the Arctic as a whole, Greenland did not experience any net warming over the most dramatic period of atmospheric CO2 increase on record. In fact, it cooled during this period ... and cooled significantly.
At the start of the 20th century, however, Greenland was warming, as it emerged, along with the rest of the world, from the depths of the Little Ice Age. What is more, between 1920 and 1930, when the atmosphere's CO2 concentration rose by a mere 3 to 4 ppm, there was a phenomenal warming at all five coastal locations for which contemporary temperature records were available. In fact, in the words of Chylek et al., "average annual temperature rose between 2 and 4°C [and by as much as 6°C in the winter] in less than ten years." And this warming, as they noted, "is also seen in the 18O/16O record of the Summit ice core (Steig et al., 1994; Stuiver et al., 1995; White et al., 1997)."
In commenting on this dramatic temperature rise, which they called the great Greenland warming of the 1920s, Chylek et al. concluded that "since there was no significant increase in the atmospheric greenhouse gas concentration during that time, the Greenland warming of the 1920s demonstrates that a large and rapid temperature increase can occur over Greenland, and perhaps in other regions of the Arctic, due to internal climate variability such as the Northern Annular Mode/North Atlantic Oscillation, without a significant anthropogenic influence."
Other studies demonstrated pretty much the same thing for the entire Arctic, as well as the Antarctic region of the globe. Overpeck et al. (1997), for example, combined paleoclimatic records from lake and marine sediments, trees and glaciers to develop a 400-year history of circum-Arctic surface air temperature. From this record they determined that the most dramatic warming of the last four centuries (1.5°C) occurred between 1840 and 1955, over which period the air's CO2 concentration rose from approximately 285 ppm to 313 ppm, or by 28 ppm. Then, from 1955 to the end of the record (about 1990), the mean circum-Arctic air temperature actually declined by 0.4°C, while the air's CO2 concentration rose from 313 ppm to 354 ppm, or by 41 ppm.
On the basis of these observations, which apply to the entire Arctic, it is not possible to assess the influence of atmospheric CO2 on surface air temperature within this region, or even conclude that it has any effect at all. Why? Because over the first 115 years of warming, as the air's CO2 concentration rose by an average of 0.24 ppm/year, the air temperature rose by an average of 0.013°C/year; while over the final 35 years of the record, when the increase in the air's CO2 content really began to accelerate, rising at a mean rate of 1.17 ppm/year (nearly five times the rate at which it had risen in the prior period), the rate of rise of surface air temperature did not accelerate anywhere near that fast. In fact, it did not accelerate at all. In fact, it decelerated, to a mean rate of change (0.011°C/year) that was nearly the same as the rate at which it had previously risen but in the opposite direction, i.e., downward. Clearly, there was something that totally overpowered whatever effect the rise in the air's CO2 content over the first period may, or may not, have had on the temperature of the Arctic, as well as the effect of the nearly five times greater rate of rise in the air's CO2 content over the second period.
Concentrating wholly on directly-measured temperatures, as opposed to the reconstructed temperatures derived by the proxy approach of Overpeck et al. (1997), Polyakov et al. (2003) derived a surface air temperature history that stretched from 1875 to 2000 based on data obtained at 75 land stations and a number of drifting buoys located poleward of 62°N latitude. This effort allowed the team of eight U.S. and Russian scientists to determine that from 1875 to about 1917, the surface air temperature of the huge northern region rose hardly at all; but then it took off like a rocket, climbing 1.7°C in just 20 years to reach a peak in 1937 that has yet to be eclipsed. During this 20-year period of rapidly rising air temperature, the atmosphere's CO2 concentration rose by a mere 8 ppm. But then, over the next six decades, when the air's CO2 content rose by approximately 55 ppm, or nearly seven times more than it did throughout the 20-year period of dramatic warming that preceded it, the surface air temperature of the region poleward of 62°N experienced no net warming and, in fact, may have actually cooled a bit.
In light of these results, it is difficult to claim much about the strength of the warming power of the approximate 75-ppm increase in the atmosphere's CO2 concentration that occurred from 1875 to 2000, other than to say it was miniscule compared to whatever other forcing factor, or combination of forcing factors, was concurrently having its way with the climate of the Arctic. One cannot, for example, claim that any of the 1917 to 1937 warming was due to the 8-ppm increase in CO2 that accompanied it, even if augmented by the 12-ppm increase that occurred between 1875 and 1917; for the subsequent and much larger 55-ppm increase in CO2 led to no net warming over the remainder of the record, which suggests that just a partial relaxation of the forces that totally overwhelmed the warming influence of the CO2 increase experienced between 1937 and 2000 would have been sufficient to account for the temperature increase that occurred between 1917 and 1937. And understood in this light, the air's CO2 content does not even begin to enter the picture.
But what about earth's other polar region: the Antarctic? Here, too, one can conclude nothing about the influence of atmospheric CO2 on surface air temperature. Why? Because for the continent as a whole (excepting the Antarctic Peninsula), there had been a net cooling over the pre-1990 period, stretching back to at least 1966 (Comiso, 2000; Doran et al., 2002; Thompson and Solomon, 2002). And when the real-world air temperature declines when the theoretical climate forcing factor is rising, one cannot even conclude that the forcing has any positive effect at all, much less determine its magnitude. Hence, there is absolutely no substance to the claim that earth's polar regions are providing evidence for an impending CO2-induced warming of any magnitude anywhere.
So what does the future hold in terms of global temperature? The answer is anyone's guess. What we do know, however, is that earth's thermal future can not be validly described by current state-of-the-art climate models that base their simulations on projections of future anthropogenic CO2 emissions. There is just too much real-world evidence to place any confidence at all in what the climate models suggest.