


The Positive Externalities of Carbon Dioxide: Estimating the Monetary Benefits of Rising Atmospheric CO2 Concentrations on Global Food Production
Historic Monetary Benefit Calculations and Results
The first step in determining the monetary benefit of historical atmospheric CO2 enrichment on historic crop production begins by calculating what portion of each crop's annual yield over the period 1961-2011 was due to each year's increase in atmospheric CO2 concentration above the baseline value of 280 ppm that existed at the beginning of the Industrial Revolution.
Illustrating this process for wheat, in 1961 the global yield of wheat from the FAOSTAT database was 10,889 hectograms per hectare (Hg/Ha), the atmospheric CO2 concentration was 317.4 ppm, representing an increase of 37.4 ppm above the 280-ppm baseline, while the CO2 growth response factor for wheat as listed in Table 2 is 34.9% for a 300-ppm increase in CO2. To determine the impact of the 37.4 ppm rise in atmospheric CO2 on 1961 wheat yields, the wheat-specific CO2 growth response factor of 34.9% per 300 ppm CO2 increase (mathematically written as 34.9%/300 ppm) is multiplied by the 37.4 ppm increase in CO2 that has occurred since the Industrial Revolution. The resultant value of 4.35% indicates the degree by which the 1961 yield was enhanced above the baseline yield value corresponding to an atmospheric CO2 concentration of 280 ppm. The 1961 yield is then divided by this relative increase (1.0435) to determine the baseline yield in Hg/Ha (10,889/1.0435 = 10,435). The resultant baseline yield amount of 10,435 Hg/Ha is subtracted from the 1961 yield total of 10,889 Hg/Ha, revealing that 454 Hg/Ha of the 1961 yield was due to the 37.4 ppm rise in CO2 since the start of the Industrial Revolution. Similar calculations are then made for each of the remaining years in the 50-year period, as well as for each of the 44 remaining crops accounting for 95% of global food production.
The next step is to determine what percentage of the total annual yield of each crop in each year was due to CO2. This was accomplished by simply taking the results calculated in the previous step and dividing them by the corresponding total annual yields. For example, using the calculations for wheat from above, the 454 Hg/Ha yield due to CO2 in 1961 was divided by the total 10,889 Hg/Ha wheat yield for that year, revealing that 4.17% of the total wheat yield in 1961 was due to the historical rise in atmospheric CO2. Again, such percentage calculations were completed for all crops for each year in the 50-year period 1961-2011.
Knowing the annual percentage influences of CO2 on all crop yields (production per Ha), the next step is to determine how that influence is manifested in total crop production value. This was accomplished by multiplying the CO2-induced yield percentage increases by the corresponding annual production of each crop, and by then multiplying these data by the gross production value (in constant 2004-2006 U.S. dollars) of each crop per metric ton, which data were obtained from the FAOSTAT database, the end result of which calculations becomes an estimate of the annual monetary benefit of atmospheric CO2 enrichment (above the baseline of 280 ppm) on crop production since 1961. And these monetary values are presented for each of the 45 crops under examination in Table 3.
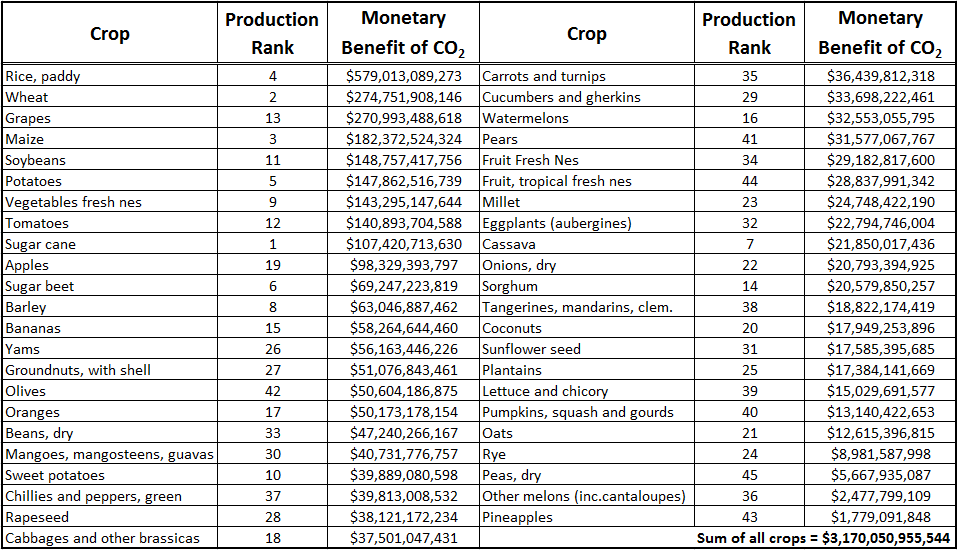
As can be seen from Table 3, the financial benefit of Earth's rising atmospheric CO2 concentration on global food production is enormous. Such benefits over the period 1961-2011 have amounted to at least $1 billion for each of the 45 crops examined; and for nine of the crops the monetary increase due to CO2 over this period is well over $100 billion. The largest of these benefits is noted for rice, wheat and grapes, which saw increases of $579 billion, $274 billion and $270 billion, respectivel.
Another interesting aspect of these calculations can be seen in Figure 1, which shows the annual total monetary value of the CO2 benefit for all 45 crops over the 50-year period from 1961-2011. As seen there, the annual value of the CO2 benefit has increased over time. Whereas it amounted to approximately $18.5 billion in 1961, by the end of the record it had grown to over $140 billion annually. And in summing these annual benefits across the entire 50-year time period, the total CO2-induced benefit on global food production since 1961 amounts to $3.2 trillion
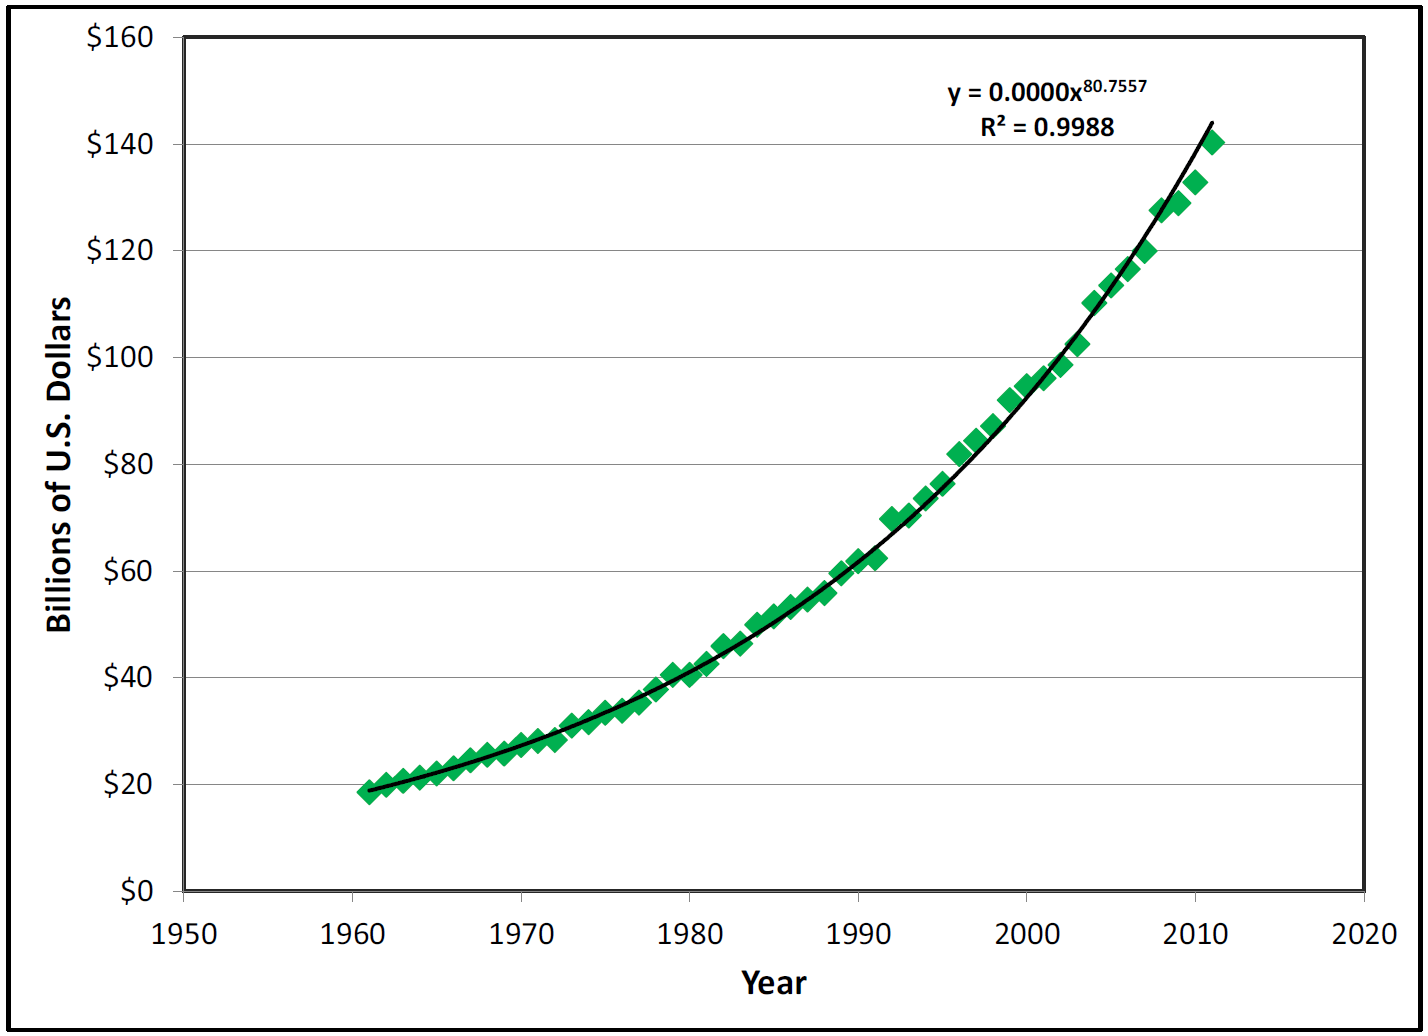
Figure 1. The total annual monetary value of the direct CO2 benefit on crop production for all 45 crops studied over the 50-year period from 1961-2011.