The Positive Externalities of Carbon Dioxide: Estimating the Monetary Benefits of Rising Atmospheric CO2 Concentrations on Global Food Production
Future Monetary Benefit Calculations and Results
The method of estimating future monetary benefits of rising atmospheric CO2 concentrations on crop production were slightly different from those used in calculating the historic values of the previous section. In explaining these methods, sugar cane will serve as the example.
First, the 1961-2011 historic yield data for sugar cane are plotted as the solid blue line in Figure 2. Next, that portion of each year's annual yield that was due to rising carbon dioxide, as per calculations described in the prior section (the solid green line), was subtracted out. The resultant values are depicted as the solid red line in Figure 2. These yield values represent the net effect of everything else that tended to influence crop yield over that time period. Although many factors play a role in determining the magnitude of this latter effect, it is referred to here as the techno-intel effect, as it derives primarily from continuing advancements in agricultural technology and scientific research that expand our knowledge or intelligence base.

Figure 2. Plot of the total yield of sugar cane over the period 1961-2011 (blue line), along with plots of that portion of the total yield attributed to advancements in agricultural technology and scientific research (the techno-intel effect, red line) and productivity increases from rising atmospheric CO2 concentrations (green line).
The difference between the techno-intel line and the observed yield line above it represents the annual yield contribution due to rising atmospheric CO2, which difference is also plotted in Figure 2 as the solid green line. As depicted there, the relative influence of atmospheric CO2 on the total yield of sugar cane is increasing with time. This fact is further borne out in Figure 3, where techno-intel yield values are plotted as a percentage of total sugar cane yield. Whereas the influence of technology and intelligence accounted for approximately 96% of the observed yield values in the early 1960s, by the end of record in 2011 it accounted for only 89%.

Figure 3. The percentage of the total annual yield of sugar cane over the period 1961-2011 that is attributed to the techno-intel effect.
Focusing on the future, the 1961-2011 linear trend of the techno-intel yield line is next projected forward to the year 2050. Depicted as the dashed red line in Figure 4, this line represents the best estimate that can be made of the effect of technology and innovation on future sugar cane crop yields. Following this step, a second-order polynomial has been fitted to the data depicted in Figure 3, and this relationship is projected forward in time (Figure 5) to obtain an estimate of the annual contribution of the techno-intel effect on the total yield through 2050. Next, the total yield for each year between 2012 and 2050 can be calculated by dividing the linear projection of the techno-intel line in Figure 4 (dashed red line) by the corresponding yearly forecasted percentage contribution of the techo-intel line to the total yield, as depicted by the polynomial projection fit to the data and extended through 2050 in Figure 5. These resultant values, plotted in Figure 4 as the dashed blue line, provide an estimate of the total annual crop yield from 2012 through 2050. By knowing the annual total yield, as well as the portion of the annual total yield that is due to the techno-intel effect between 2012 and 2050, the part of the total yield that is due to CO2 can be calculated by subtracting the difference between them. These values are also plotted in Figure 4 as the dashed green line.

Figure 4. Same as Figure 2, but with the added projections of the total yield and the portion of the total yield due to the techno-intel and CO2 effects estimated for the period 2012-2050 (dashed blue, red, and green lines, respectively).

Figure 5. Same as Figure 3, but with a second order polynomial equation fit to the 1961-2011 data, projecting the data forward through 2050.
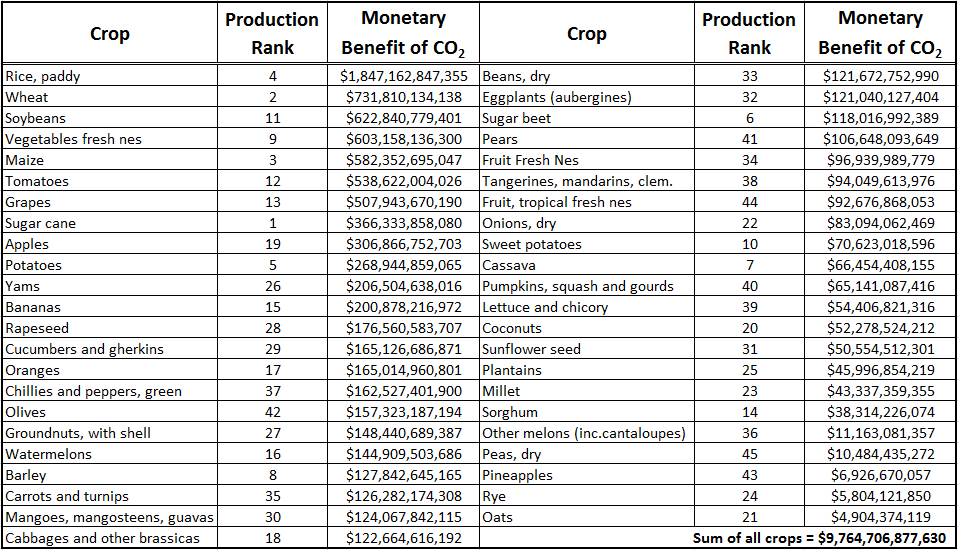
In order to apply the future estimates of the CO2 influence on crop yields to future estimates of crop production, linear trends in each of the 45 crops' 1961-2011 production data were next extended forward in time to provide projections of annual production values through 2050. As with the historic calculations discussed in the previous section, these production values were multiplied by the corresponding annual percentage influence of CO2 on 2012-2050 projected crop yields. The resultant values were then multiplied by an estimated gross production value (in constant 2004-2006 U.S. dollars) for each crop per metric ton. And as there are several potential unknowns that may influence the future production value assigned to each crop, a simple 50-year average of the observed gross production values was applied over the period 1961-2011. The ensuing monetary values for each of the 45 crops over the 2012 through 2050 period are listed in Table 4.

The results of the above set of calculations once again reveal a tremendous financial benefit of Earth's rising atmospheric CO2 concentration on global food production. Over the period 2012 through 2050, the projected benefit amounts to $9.8 trillion, which is much larger than the $3.2 trillion that was observed in the longer 50-year historic period of 1961-2011.


