


Center Experiment #4: Real-Time Results
Real-Time Results
Real-Time Results: Week 5
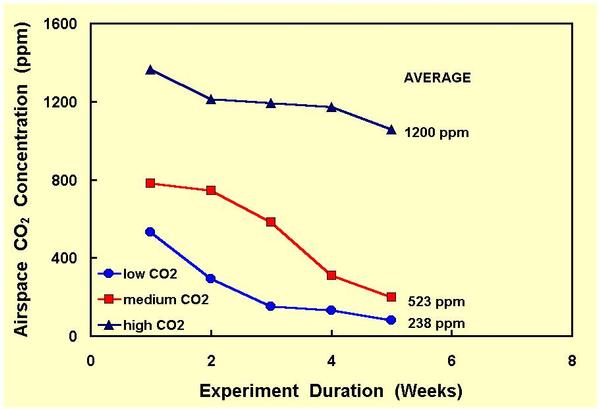 As can be seen in Figure 1, the mean CO2 concentration in the low-CO2 unit this past week dropped to only 82 ppm; and as we expected, it did indeed bring about the death of three of that unit's eight plants.
 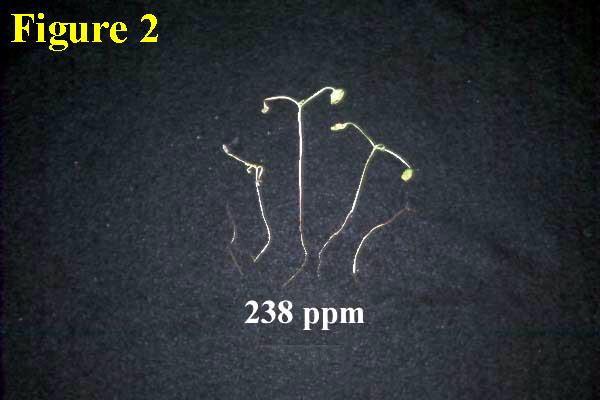 Hence, upon making our last CO2 measurements, we terminated the experiment and harvested the plants in all of the aquariums.
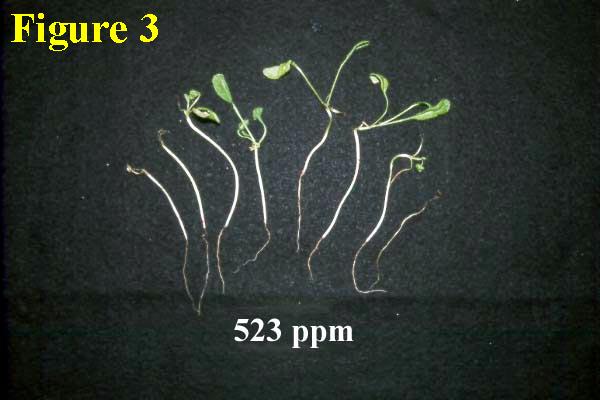
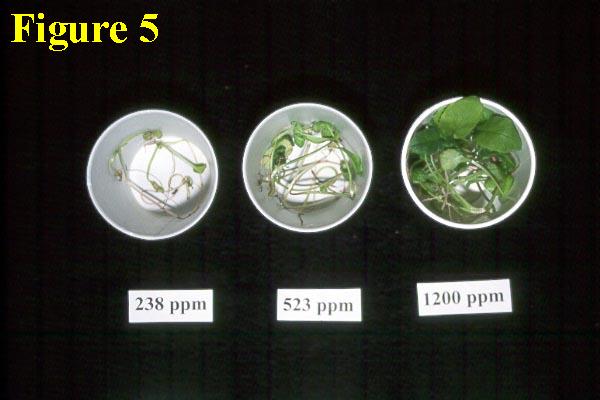
Figure 2 depicts the five living and partially-alive plants we were able to extract from the low-CO2 experimental unit; Figure 3 depicts all eight of the plants that grew in the medium-CO2 unit; and Figure 4 shows the eight plants that grew in the high-CO2 unit. 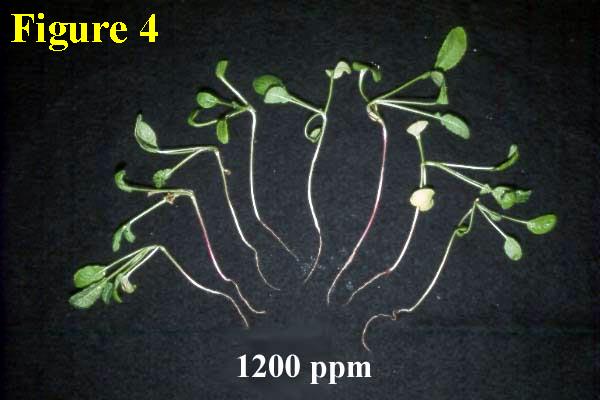 Last of all, Figure 5 depicts all plants from each CO2 treatment after they had been placed in paper cups and made ready for drying in an oven to drive off the water contained in their tissues.
The last step is to plot the mean dry weight per plant (obtained by dividing each experimental unit's total plant dry weight by eight) as a function of each unit's experiment-long average airspace CO2 concentration. These results are found in the Final Results section.