Reference
Moberg, A., Sonechkin, D.M., Holmgren, K., Datsenko, N.M. and Karlen, W. 2005. Highly variable Northern Hemisphere temperatures reconstructed from low- and high-resolution proxy data. Nature 433: 613-617.
Description
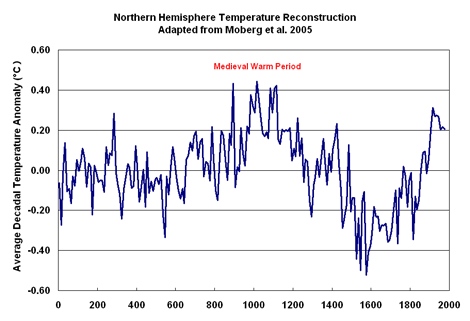
The authors present a temperature history of the Northern Hemisphere that spans the past two millennia. It was produced from two different sources of paleoclimatic data: tree-rings, which capture very high frequency climate variations, and lake and ocean sediments, which Moberg et al. say "provide climate information at multicentennial timescales that may not be captured by tree-ring data." Using data provided by the authors, we have produced a graph of average decadal temperature anomalies, shown below, in which the Medieval Warm Period peaks just prior to AD 900 and is strongly expressed between about AD 650 and 1250. Peak temperatures during this time period are about 0.22°C higher than those at the end of the Moberg et al. record. Instrumental data suggest significant subsequent warming; but the directly-measured temperatures cannot be validly compared with the reconstructed ones. Hence, it is not possible to determine if current temperatures have eclipsed those of a thousand years ago or whether they still fall below them; and the fairest thing to do, in our estimation, is to tentatively conclude (for this data set only) that the peak temperatures of both periods are approximately equivalent.