Reference
Li, G.X., Sun, X.Y., Liu, Y., Bickert, T. and Ma, Y.Y. 2009. Sea surface temperature record from the north of the East China Sea since late Holocene. Chinese Science Bulletin 54: 4507-4513.
Description
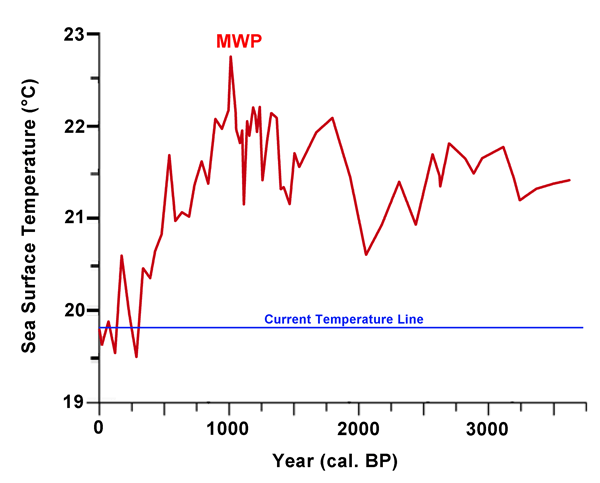
Working with a sediment core extracted from the northern East China Sea (31.68°N, 125.81°E) in June of 2006, the authors employed the alkenone paleotemperature index Uk'37 -- together with the Muller et al. (1998) calibration equation -- to construct a sea surface temperature history of that region covering the past 3600 years. And of this period, as they describe it, "the highest temperature was 22.7°C which was recorded at 1.01 cal ka BP," about three-fifths of the way through the Medieval Warm Period. And since they note that cooling prevailed "from 0.85 cal. ka BP to present," at which latter point they indicated a temperature of 19.78°C, we calculate that the peak warmth of the MWP was 2.9°C greater than the mean warmth of the first decade of the 21st century, which is often touted as being the warmest decade of the instrumental period.

Muller, P.J., Kirt, G., Ruhland, G., von Storch, I. and Rosell-Melé, A. 1998. Calibration of the alkenone paleotemperature index Uk'37 based on core-tops from the Eastern South Atlantic and the global ocean (60°N-60°S). Geochimica et Cosmochimica Acta 62: 1757-1772.


