MWP-CWP Quantitative Temperature Differentials

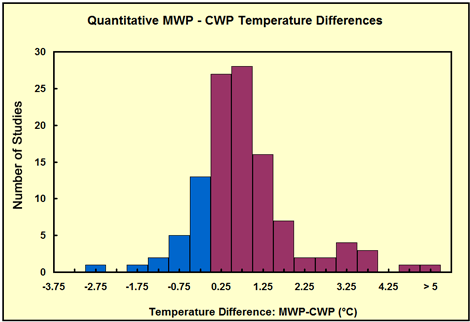
Figure Description: The distribution, in 0.5°C increments, of Level 1 Studies that allow one to identify the degree by which peak Medieval Warm Period temperatures either exceeded (positive values, red) or fell short of (negative values, blue) peak Current Warm Period temperatures.


