Volume 9, Number 40: 4 October 2006
In order to assess the uniqueness of the current temperature regime in any part of the world, it is important - nay, necessary - to know its past temperature history; and to determine if a region's current temperature regime may validly be attributed to CO2-induced global warming, it is important that its temperature history stretch as far back in time as possible. Consequently, and as "the temporal variability of Antarctic climate is not well known, as continuous meteorological observations in the Antarctic began only in the late 1950s," according to Schneider et al. (2006), this group of seven researchers decided to utilize 200 years of sub-annually-resolved δ18O and δD records from precisely-dated ice cores obtained from Law Dome, Siple Station, Dronning Maud Land and two West Antarctic sites of the United States component of the International Trans-Antarctic Scientific Expedition to create "a 200-year-long Antarctic temperature reconstruction (representing the main part of the continent) methodologically similar to temperature reconstructions covering other geographic regions."
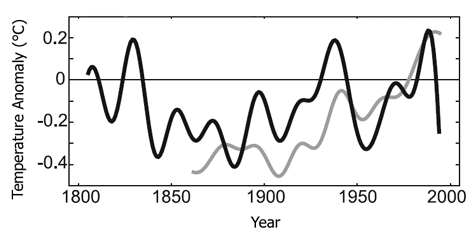
The results of this significant undertaking, following application of a multi-decadal low-pass filter to the yearly data, are presented in the figure below, along with the similarly-treated data of the Southern Hemisphere instrumental temperature record, where the zero line represents the 1961-1990 climatological means of the two records. We present the figure for the purpose of discussing what Schneider et al. have to say about it, much of which we consider to be rather disingenuous.

Figure 1. Mean temperature histories of Antarctica (dark line) and the Southern Hemisphere (lighter line), adapted from the paper of Schneider et al. (2006).
In reference to the figure, its creators say "it is notable that the reconstructed Antarctic temperature record is in phase with the Southern Hemisphere mean instrumental record." This statement roughly describes the relationship between the two histories, but only until 1990, after which the Antarctic temperature history takes a "nosedive" and dramatically diverges from the Southern Hemisphere record.
The seven scientists also say the Antarctic temperature reconstruction "provides evidence for long-term Antarctic warming," and if all the data we had were those that stretch from 1840 to 1990, one might be inclined to believe them. However, when their "before and after" data are included, this statement is readily seen to be false. In fact, the entire record suggests the existence of a multi-decadal or centennial-scale cycling of climate, where Antarctic temperatures in the early 1800s were equally as warm as they were in the late-1930s/early-1940s, as well as in the late-1980s/early-1990s.
We additionally note that a number of other analyses of Antarctic instrumental surface and air temperature data also indicate the continent has recently experienced a net cooling, which likely began as early as the mid-1960s (Comiso, 2000; Doran et al., 2002; Thompson and Solomon, 2002). Furthermore, it is obvious from the figure we adapted from Schneider et al. that there has been a net cooling over the entire course of their Antarctic temperature reconstruction of nearly 0.3°C.
So what do Schneider et al.'s data really suggest? First of all, their data suggest there was nothing unusual, unnatural or unprecedented about any Antarctic temperatures of any part of the 20th century. Second, their data demonstrate it was significantly colder in Antarctica near the end of the 20th century than it was in the early decades of the 19th century (when the atmosphere's CO2 concentration was about 100 ppm less than it is currently), while the data of others indicate it may be even colder there today. Finally, Schneider et al.'s data indicate there is something drastically wrong with the theory of anthropogenic-induced global warming, when a 100-ppm increase in the air's CO2 concentration leads to a large decrease in air temperature in a part of the world (one of earth's two polar regions) where CO2-induced greenhouse warming is predicted to be most dramatic and most readily detected.
Sherwood, Keith and Craig Idso
References
Comiso, J.C. 2000. Variability and trends in Antarctic surface temperatures from in situ and satellite infrared measurements. Journal of Climate 13: 1674-1696.
Doran, P.T., Priscu, J.C., Lyons, W.B., Walsh, J.E., Fountain, A.G., McKnight, D.M., Moorhead, D.L., Virginia, R.A., Wall, D.H., Clow, G.D., Fritsen, C.H., McKay, C.P. and Parsons, A.N. 2002. Antarctic climate cooling and terrestrial ecosystem response. Nature advance online publication, 13 January 2002 (DOI 10.1038/nature710).
Schneider, D.P., Steig, E.J., van Ommen, T.D., Dixon, D.A., Mayewski, P.A., Jones, J.M. and Bitz, C.M. 2006. Antarctic temperatures over the past two centuries from ice cores. Geophysical Research Letters 33: 10.1029/2006GL027057.
Thompson, D.W.J. and Solomon, S. 2002. Interpretation of recent Southern Hemisphere climate change. Science 296: 895-899.


