Reference
Vinnikov, K.Y., Cavalieri, D.J. and Parkinson, C.L. 2006. A model assessment of satellite observed trends in polar sea ice extents. Geophysical Research Letters 33: 10.1029/2005GL025282.
What was done
The authors present and discuss the time series of satellite observed monthly sea ice extents for earth's north and south polar regions based on the work of Cavalieri et al. (2003) plus monthly updates through 2004.
What was learned
Vinnikov et al. note that "Cavalieri et al. (1997) reported hemispheric asymmetry in global sea ice changes during 1978-1996, including opposing trend lines." Specifically, the annual mean area of Arctic sea ice declined over this period, as models of CO2-induced global warming suggest it should have done; but at the same time, Antarctic sea ice area expanded, contrary to model predictions. Now, however, when "the data from the early and mid-1970s are included," the three researchers say that the discrepancy in trends has been resolved, and that "it is no longer the case that the sign of the trend in the two cases differs."
What it means
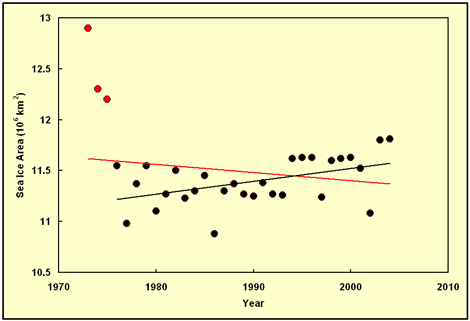
With another data discrepancy claimed to have been resolved, the logical conclusion to draw would be that the case for CO2-induced global warming has been significantly strengthened. However, a closer look at the Southern Hemisphere data, which we have plotted below (based upon our best attempt to decipher their values from Vinikov et al.'s Figure 1), shows such thinking to be false.

Satellite observed annual mean sea ice extent in the Southern Hemisphere. The black linear regression line was derived from the black data points; the red linear regression line was derived from all the data points (black + red).
In viewing the figure above, it can be seen that the red trend line for the entire data set (black + red points) is indeed negative, suggestive of a gradual decline in Southern Hemisphere sea ice extent over the period of record. As should be obvious to anyone who is not blind, however, what is suggested by the red trend line is not what the data show. What they show is an initial dramatic decline in sea ice extent at the start of the record (between 1973 and 1976), followed by a gradual increase in sea ice extent over the subsequent 28 years.
The 28-year sustained increase in Southern Hemisphere sea ice extent is the real story here. Over this period (1976-2004), the air's CO2 concentration rose by approximately 45 ppm, at a rate and to a level not seen on earth for perhaps a million or more years. Yet this supposedly tremendous force for global warming could not stop the sea ice around Antarctica from steadily expanding in area.
So what's the story with the three data points for 1973, 4 and 5? Are they erroneous, or are they correct? The answer makes little difference. If they're erroneous, they clearly have nothing to do with the climate-altering power of CO2. If they're correct, they also have nothing to do with the climate-altering power of CO2; for the increase in the air's CO2 concentration between 1973 and 1976 was only 3 ppm, and if a 45-ppm increase in atmospheric CO2 concentration could not cause the sea ice extent around Antarctica to decline, a mere 3-ppm increase should not be expected to cause it to do so either.
Over the last three decades, therefore, Northern Hemisphere sea ice extent behaved as suggested by climate models; but Southern Hemisphere sea ice extent defied the model predictions and did just the opposite. And if the theory of CO2-induced global warming is correct, sea ice extent in both hemispheres should have declined. Hence, the totality of evidence testifies to the invalidity of the anthropogenically-augmented greenhouse effect theory.
References
Cavalieri, D.J., Gloersen, P., Parkinson, C.L., Comiso, J.C. and Zwally, H.J. 1997. Observed hemispheric asymmetry in global sea ice changes. Science 272: 1104-1106.
Cavalieri D.J., Parkinson, C.L. and Vinnikov, K.Y. 2003. 30-year satellite record reveals contrasting Arctic and Antarctic decadal sea ice variability. Geophysical Research Letters 30: 10.1029/2003GL018031.
Reviewed 17 May 2006


