


| Tweet | Follow @co2science |
Paper Reviewed
Margaritelli, G., Cacho, I., Catala, A., Barra, M., Bellucci, L.G., Lubritto, C., Rettori, R. and Lirer, F. 2020. Persistent warm Mediterranean surface waters during the Roman period. Scientific Reports 10: 10431, doi.org/10.1038/s41598-020-67281-2.
Many people (including the IPCC) are concerned that if the modern warming trend continues and reaches a value that is more than 2°C above pre-industrial times, a climate catastrophe will ensue. Thus the collective mantra of climate alarmists has long been to restrict all warming below this magical value: warming below 2°C is somehow ok, while warming above 2°C will unleash end-of-world disaster.
But how realistic is such danger?
An easy way to gain insight into just how dangerous such warming could be is to look to the past -- to see if temperatures have ever risen above the so-called "dangerous" 2°C above preindustrial value threshold and if climate Armageddon indeed ensued. And, mind you, climate alarmists are on record claiming that temperatures have already risen between 1 and 1.5°C since preindustrial times, meaning that temperatures cannot rise more than 0.5 to 1.0°C in the future or the dangerous tipping point will be reached!
So, has humanity ever before encountered such unsafe temperatures and did they reap the whirlwind when experiencing it?
Great insight into this important question can be gained from a recently published paper by Margaritelli et al. (2020), who examined temperatures in the Mediterranean basin over the past 5500 years. As their contribution to this important topic, the team of eight researchers reconstructed sea surface temperatures (SST) in the Sicily Channel based on Mg/Ca ratios measured on the planktonic foraminifer Globigerinoides ruber. The resultant temperature proxy they derived is presented in Figure 1.
In viewing the details of this record, we find considerable decadal variability of temperatures superimposed on a long-term warming trend of more than 6°C from the start of the record until around AD 400. Thereafter temperatures follow a general decline toward the present, with brief warming trends during medieval times and the most recent century interrupting the longer-term cooling trend.
Placing this record within the context of the current discussion, Figure 2 highlights times when temperatures eclipsed the so-called dangerous temperature zone, reaching historic SST values that were more than 2°C greater than that observed during recent preindustrial times. Such supposedly treacherous times of unsafe warming were reached during the Medieval Warm Period (~AD 1200-1400), the Roman Warm Period (~AD 0-550), and during an earlier warm period centered around 500 BC. And how "dangerous" was this warming effect on humanity?
According to Margaritelli et al., who focused the bulk of their paper on the Roman Warm Period, this five-century-long period of temperatures within the purported dangerous zone was "characterized by [human] prosperity and expansion," which warming ultimately brought about conditions that "developed the greatest ancient civilization of all time, the Roman one."
Imagine that. Rather than harming or destroying humanity, the warm temperatures of the Roman Warm Period actually helped human society to flourish, which reality is the opposite of what climate alarmists are claiming today. And when we consider all of the technological advancements that have occurred in the 1600 years since the Roman Warm Period, it is the height of stupidity to think that humanity could not collectively experience temperatures within the so-called dangerous zone and not come out on top.
Clearly, proclaiming any warming more than 2°C above preindustrial values as "dangerous" as the climate alarmists do, is flat out false. It is not grounded in science or in human history. Consequently, their efforts to prevent such warming by eliminating all use of fossil fuels must be based on ulterior motives, motives which are likely far more nefarious than they would have us believe.
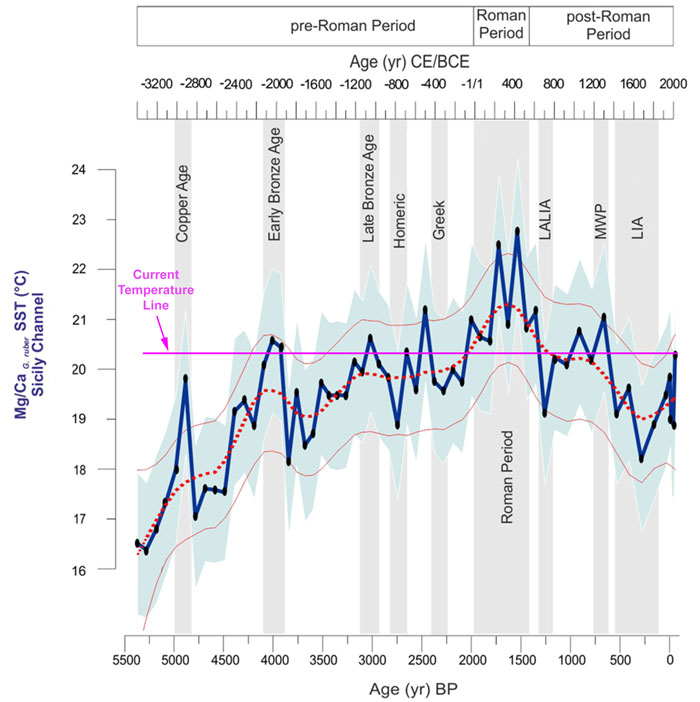
Figure 1. Sea surface temperature (SST) reconstruction from Sicily Channel (Mg/Ca G.ruber core SW104-ND11). The red dashed line represents the 95% CI smoothed curve (Monte Carlo simulation) and the thin red lines are the 2.5% and the 97.5% CI of 10000 LOESS fitted realizations of the data. The black dots over the Sicily Channel record (blue curve) represent analyzed data points and the light blue shadow is the propagation error. The grey bands show the main climate events documented in the Mediterranean basin. Source: Margaritelli et al. (2020).
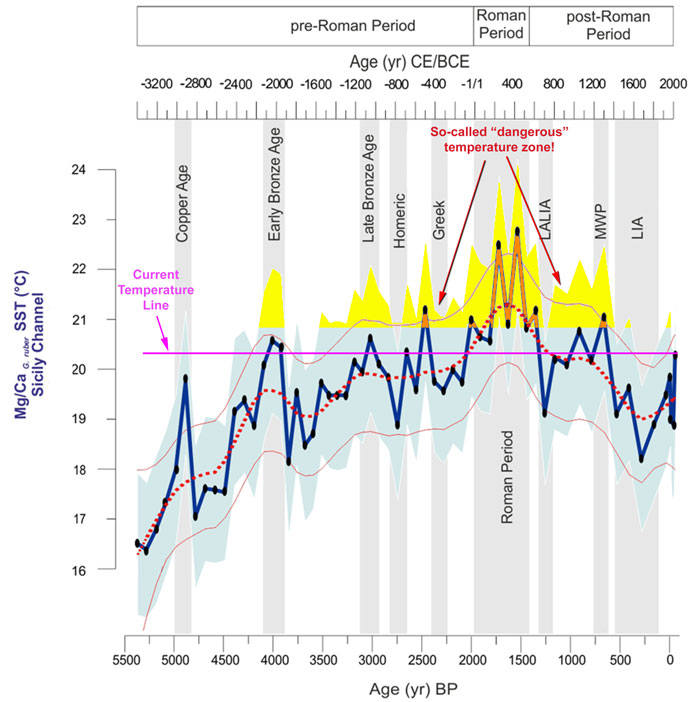
Figure 2. Same as Figure 1, but with yellow shading and orange line color to highlight the dangerous warming zone where historical temperatures were more than 2°C warmer than preindustrial times.