


| Tweet | Follow @co2science |
Paper Reviewed
Higginbottom, T.P. and Symeonakis, E. 2020. Identifying ecosystem function shifts in Africa using breakpoint analysis of long-term NDVI and RUE data. Remote Sensing 12: 1894, doi:10.3390/rs12111894.
Since 1980, the population of Africa has grown by approximately 850 million persons, which increase in the words of Higginbottom and Symeonakis (2020) has "transform[ed] the intensity and distribution of land use activities, such as, fuelwood harvesting, animal husbandry and farming." Consequently, there is concern with regard to the effects of this massive population rise on the continent's ecosystems, especially in an era of climate alarmism that posits CO2-induced global warming should also be wreaking havoc on African flora. But is this really happening?
Higgenbottom and Symeonakis' new paper addresses this question and answers it with a resounding no! In stark contrast, rather than experiencing widespread decline, the continent's vegetation has been increasing in vigor over the past three and a half decades.
In reaching this conclusion the two United Kingdom researchers utilized satellite-derived remote sensing data from the AVHRR sensors on seven NOAA satellites to study trends in African vegetation over the period 1982-2015. The specific indices employed included the Normalized Difference Vegetation Index (NDVI) and a measure for Rain Use Efficiency (RUE), the latter of which indices was calculated as the ratio of growing season NDVI over total annual rainfall so as to better understand the impact of precipitation on the NDVI trends. Then, for each data set the authors performed advance statistical analyses to determine the temporal trends at an 8-km pixel level. The results are presented in the figure below.
As reported by Higginbottom and Symeonakis, the trend in each pixel was assigned to one of the following categories: (1) monotonic increase (a significant increase with no significant break detected over the period of study), (2) monotonic decrease (a significant decrease with no significant break detected, (3) interruption with a negative break (a significant increase with a significant break followed by a significant increase), (4) interruption with a positive break (a significant decrease with a significant break followed by a significant decrease), (5) negative reversal (a significant increase with a significant break followed by a significant decrease), (6) positive reversal (a significant decrease with a significant break followed by a significant increase) or (7) no change or a nonsignificant change. The pixels with their associated trend category/direction are depicted in Figure 1.
The most striking feature of the accompanying figure is the domination of green shading, indicative of monotonic increasing trends and positive reversal trends, both of which categories reveal significant enhancements of African vegetation since 1982. Furthermore, the authors write "there was no continental (or hemispheric) shift towards negative trends in either RUE or NDVI and the overall trend continues to be of vegetation greening."
With respect to the apparent cause of this incredible feat, the researchers note "as increases occur almost pan-continentally, large-scale drivers should be considered as contributing factors for globally observed trends," drivers "such as increases in reactive nitrogen deposition and elevated atmospheric CO2, which increase the maximum potential vegetation production."
And so it is that, despite increasing in population by 850 million persons and being subjected to the many ecosystem pressures a population increase of that size can cause, and notwithstanding numerous ominous climate-related projections of ecosystem demise from global warming, across large regions of Africa vegetative productivity today has reached the highest values ever observed in the satellite record. And this great greening of Africa has largely been brought about by the very factor alarmists say should be causing a demise -- rising atmospheric CO2!
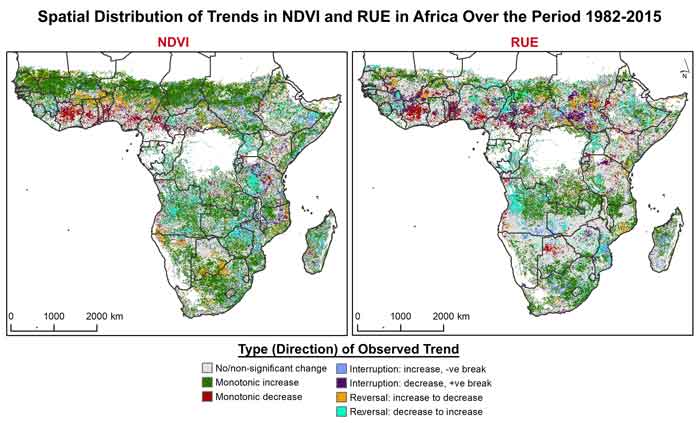
Figure 1. Spatial distribution of significant trends in Normalized Difference Vegetation Index (NDVI) and Rain Use Efficiency (RUE) data in Africa over the period 1982-2015. The direction or type of trend is indicated in the color legend. -ve = a negative break in the trend, +ve = a positive break in the trend as discussed in the text above. Adapted from Higginbottom and Symeonakis (2020).