


| Tweet | Follow @co2science |
Paper Reviewed
Zhu, J., Poulsen, C.J. and Otto-Bliesner, B.L. 2020. High climate sensitivity in CMIP6 model not supported by paleoclimate. Nature Climate Change 10: 378-379.
The magnitude of long-term warming predicted in response to a given rise in atmospheric CO2 defines a model's equilibrium climate sensitivity (ECS). Over the past four decades, the range of ECS predicted by various versions of climate models has remained relatively unchanged, with a doubling of the air's CO2 content above its preindustrial value of 285 ppm expected to cause a global mean surface air temperature increase between 1.5 and 4.5 °C. However, recent model revisions have produced larger ECS values.
Writing in the journal Nature Climate Change, Zhu et al. (2020) note that 10 of the 27 climate models participating in the most recent Coupled Model Intercomparison Project phase 6 (CMIP6) "have an ECS higher than the upper end of the [long-predicted 1.5 to 4.5 °C] range," whereas only two out of twenty-eight models were above this upper range in the previous CMIP assessment (CMIP5).
So, why the sudden shift to larger ECS values? And is this shift justified?
The three scientists explore these questions by evaluating predictions of global mean surface temperature (GMST) and meridional sea surface temperature gradient (MTG) from a key CMIP6 model against a historical benchmark period -- the early Eocene climatic optimum (~50 million years ago), a period in which atmospheric CO2 concentrations were between 3 and 9 times the pre-industrial value. The CMIP6 model utilized was the Community Earth System Model version 2 (CESM2). CESM2, according to Zhu et al. "is among the best-performing CMIP6 models based on mean pattern correlations of a variety of climate fields." However, despite such capability Zhu et al. report its GMST and MTG projections for the early Eocene climatic optimum (EECO) are "not supported by geological evidence."
As depicted in the figure below, EECO simulations at one, two and three times preindustrial CO2 values. Shockingly, at three times the preindustrial CO2 value (which represents the low end of the proxy CO2 range) the modelled GMST is 5.5 °C greater than the upper end of proxy temperature estimates (see Figure 1). What is more, Zhu et al. report that "modelled tropical land temperature exceeds 55 °C, which is much higher than the temperature tolerance of plant photosynthesis and is inconsistent with fossil evidence of an Eocene Neotropical rainforest." And to add insult to injury, the three scientists also plot GMST projections using a predecessor to this, CESM version 1, revealing this older version with a lower ECS does a far better job in predicting EECO GMST and MTG (also see Figure 1). Consequently, the authors conclude that "the high ECS in CESM2 is incompatible with known Eocene greenhouse climate," adding "we expect that other models with similarly high ECS may also be biased too warm when driven by high levels of atmospheric CO2." With respect to the cause of this failure, the authors say that it "has been attributed to cloud feedback -- that is, the amplification of surface warming through changes in clouds."
In commenting on these findings Zhu et al. say their study "illustrates that the development and tuning of models to reproduce the instrumental record does not ensure that they will perform realistically at high CO2." Indeed it does not. And that is a pretty damning indictment that can be applied to the whole of the climate modeling enterprise: after billions of dollars spent and 40 years of work, modelers have not only failed to reduce ECS range for a doubling of CO2, they have raised it to levels unsupported by proxy data in the most recent state-of-the-art model versions.
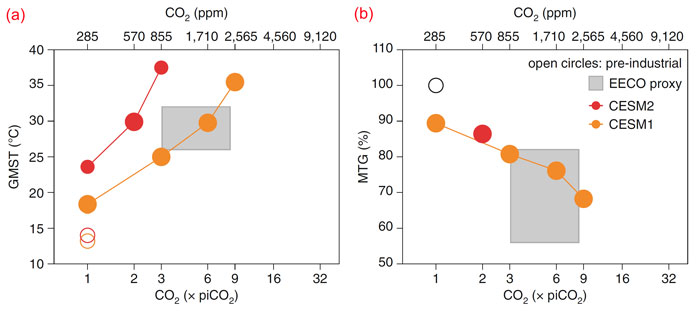
Figure 1. Model-data comparison of GMST (panel a) and MTG (panel b) during the EECO. Panel a plots GMST as a function of atmospheric CO2 based on proxy estimates (grey box) and model simulations using CESM2 (red line and dots) and CESM1 (orange line and dots) estimates. Panel b is the same as Panel a, but for MTG in percent of the corresponding pre-industrial values. For reference, pre-industrial GMST and MTG are marked as open circles in both panels. Note the x-axis is logarithmic in scale and pre-industrial CO2 = 285 ppm. Adapted from Zhu et al. (2020).