| Tweet | Follow @co2science |
Paper Reviewed
Pan, C., Ahammed, G.J., Li, X. and Shi, K. 2018. Elevated CO2 improves photosynthesis under high temperature by attenuating the functional limitations to energy fluxes, electron transport and redox homeostasis in tomato leaves. Frontiers in Plant Science 9: Article 1739, doi: 10.3389/fpls.2018.01739.
Heat stress can cause a multitude of challenges to plant growth and survival, including dehydration and oxidative damage to biomembranes from elevated reactive oxygen species (ROS). Yet elevated levels of CO2 have been shown to lessen the severity of this stress. Thus, there is interest in determining the interactive effects of heat stress and atmospheric CO2 on plants given predictions of future elevated temperatures and CO2 concentrations.
Such was the topic of investigation by Pan et al. (2018), who studied the interactive effects of elevated CO2 and heat stress on a range of photosynthetic and chlorophyll fluorescence parameters, as well the cellular redox state, of tomato plants.
The work was conducted in environmentally controlled growth chambers (E8 Growth Chamber, Conviron, Winnipeg, MB, Canada), where tomato seedlings (Solanum lycopersicum cv. Hezuo 903) were exposed to CO2 concentrations of either either 380 ppm or 800 ppm. Then, following an acclimation period of 48 hours, half of the seedlings in each CO2 treatment were subjected to 24 hours of heat stress (42°C, compared to unstressed day/night temperatures of 26/22°C in control plants), followed by a 24 hour recovery period. After 24 hours of heat stress and again after the 24 hour recovery period to control temperatures, a range of measurements were taken to evaluate the ability of elevated CO2 to mitigate temperature stress. The results are depicted in the two figures below.
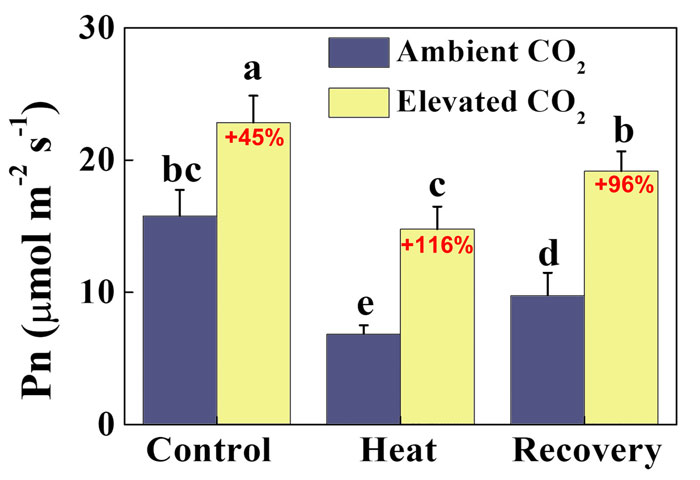
Figure 1 presents the CO2-induced response of the tomato plants on net photosynthesis during the control, heat and recovery period. At normal temperatures, elevated CO2 increased net photosynthesis by 45%. Not surprisingly, regardless of CO2 concentration, heat stress reduced net photosynthesis, which parameter increased during the recovery period but not quite back to its pre-stressed condition. Nevertheless, elevated CO2 caused a relative increase in net photosynthesis of 116% and 96% during heat stress and recovery, which values were not significantly different than that observed in the control treatment under normal CO2. Thus, elevated CO2 was able to fully ameliorate the negative effects of heat stress on net photosynthesis of the tomato plants.
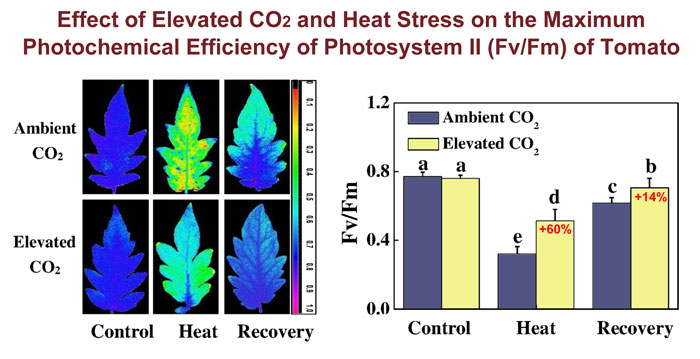
A similar finding is noted in Figure 2, which presents the effects of elevated CO2 and heat stress on the maximum photochemical efficiency of photosystem II (Fv/Fm). Although elevated CO2 had no effect on Fv/Fm under normal temperature conditions, it increased this parameter by 60% and 14% in response to heat stress and at recovery, respectively, compared with that observed in the ambient CO2 treatments.
In commenting on these and other of their findings, Pan et al. write that the "heat stress-caused drastic reduction in CO2 assimilation rate was attributed to simultaneous declines in Vcmax and Jmax. Furthermore, heat-induced excessive production of ROS caused damage to photosynthetic apparatus as evidenced by decreased Fv/Fm, low electron transport rate and altered oxidized and reduced states of PSII and PSI. On the other hand, elevated CO2 remarkably attenuated heat-induced damage to photosynthetic apparatus and promoted electron transport in PSII and PSI by maintaining proper redox balance." And this amelioration of heat stress by CO2 is great news for plants exposed to periodic high temperatures stress.

Figure 1. Effects of elevated CO2 and heat stress on the net photosynthetic rate (Pn) of tomato plants. The red text shows the change in Pn due to elevated CO2 during the control, heat and recovery stage. Source: Pan et al. (2018).

Figure 2. Effects of elevated CO2 and heat stress on the photosynthetic apparatus of tomato. The left panel displays the maximum photochemical efficiency of photosystem II (Fv/Fm) shown in pseudo color images, the false color code depicted in the image ranges from 0 (black) to 1 (purple). The right panel shows the actual Fv/Fm values, with the percentages in red text indicating the change in Fv/Fm values due to elevated CO2 during the heat and recovery period. Source: Pan et al. (2018).


