


| Tweet | Follow @co2science |
Paper Reviewed
Zhuang, L., Yang, Z., Fan, N., Yu, J. and Huang, B. 2019. Metabolomic changes associated with elevated CO2-regulation of salt tolerance in Kentucky bluegrass. Environmental and Experimental Botany 165: 129-138.
The excessive accumulation of sodium in soils (i.e., salinity stress) is harmful to plants and induces physiological damages. Elevated levels of atmospheric CO2, in contrast, have been shown to promote plant growth and alleviate stresses. Thus, it was the design of authors Zhuang et al. (2019) to study the combined effects of elevated CO2 and salinity stress on Kentucky bluegrass (Poa pratensis cv. Kenblue).
The work was conducted in growth chambers under controlled environments over a period of 42 days. Treatments included control (ambient CO2 concentration of 400 ppm and 250 mL of salt-free irrigation water daily), elevated CO2 (elevated CO2 concentration of 800 ppm and 250 mL of salt-free irrigation daily), salt stress (ambient CO2 and 250 mL of daily irrigation water containing 200 mM NaCl solution to induce salt stress) and combined elevated CO2 and salt stress (800 ppm and 250 mL of daily irrigation water containing 200 mM NaCl solution). During each week of the experiment the researchers measured a number of plant growth and physiological indices to evaluate the impact of the two variables. Then, at the end of the 42 day study period they sampled fresh leaves and roots to determine leaf ion contents and to extract and quantify various metabolites, hoping to discern the mechanisms behind the physiological changes observed in their study.
In terms of growth, elevated CO2 had a positive effect while salinity stress had a negative effect, evidenced by the relative growth rate and net photosynthesis data presented in the figure below. With respect to the combined elevated CO2 and salinity stress treatment, Zhuang et al. report that "elevated CO2 effectively ameliorated plant growth and physiological damages due to salt stress, as shown by the increase in turf quality, relative water content, leaf chlorophyll content, shoot growth rate, net photosynthetic rate, and K+ content, as well as by the reduction in electrolyte leakage and Na+ content in both leaves and roots." What is more, they add that elevated CO2 "altered metabolic profiles of leaves and roots exposed to salt stress, with enhanced accumulation of organic acids (quinic acid, mucic acid, pyruvic acid, citric acid, lactic acid, malic acid, fumaric acid, and shikimic acid in leaves; citric acid, fumaric acid, gluconic acid, galacturonic acid, isocitric acid, glyceric acid, succinic acid, and malonic acid in roots), sugars (glucose, fructose, hexopyranose, gulose, tagatose, mannose, sucrose, trehalose, cellobiose in leaves; glucose, galactose, hexopyranose, sucrose, trehalose, lactose, turanose in roots), sugar alcohols (galactinol, glycerol in leaves and galactinol, glycerol, mannitol in roots), sterols (Β-sitosterol in leaves and stigmasterol, Β-sitosterol, campesterol in roots), and fatty acids (linolenic acid and palmitic acid in both leaves and roots)." Such CO2-induced metabolite changes, according to the authors, are likely the reason why elevated CO2 improved the salt tolerance of this perennial grass species. And these findings are great news for plants that are growing in areas subjected to salt stress. In the future, they will grow better because of rising CO2.
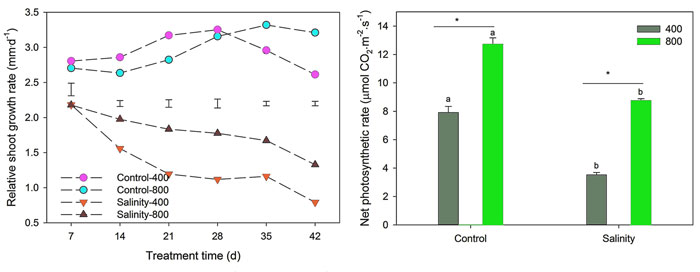
Figure 1. Effects of CO2 concentration on relative shoot growth (left panel) and net photosynthetic (right panel) rates of Kentucky bluegrass exposed to salt stress. The 400 and 800 refer to ambient (400 ppm) and elevated (800 ppm) CO2 concentrations, respectively. Vertical bars in the left panel represent significant difference between different treatments based on LSD values (P ≤ 0.05). Vertical bars in the right panel indicate standard errors of the mean for each treatment. Columns marked with small letters and * represent the salt-induced significant differences at a given CO2 concentration and the elevated CO2-induced significant differences at either control or salt stressed condition, respectively, based on LSD values (P ≤ 0.05). Source: Zhuang et al. (2019).