


| Tweet | Follow @co2science |
Paper Reviewed
Gaire, N.P., Dhakal, Y.R., Shah, S.K., Fan, Z.-X., Bräuning, A., Thapa, U.K., Bhandari, S., Aryal, S. and Bhuju, D.R. 2019. Drought (scPDSI) reconstruction of trans-Himalayan region of central Himalaya using Pinus wallichiana tree-rings. Palaeogeography, Palaeoclimatology, Palaeoecology 514: 151-264.
Writing as background for their study, Gaire et al. (2019) say that "knowledge of the long-term frequency and intensity of drought events in an area is crucial since drought has adverse effects on natural ecosystems, food security, economy, society, and civilization." And thus it was their objective to develop a long-term drought record for the Dolpo area of the trans-Himalayan region of Nepal, which region they say has been neglected in this regard.
To accomplish their design, the nine researchers collected and analyzed some 50 tree-ring cores from blue pine (Pinus wallichiana) trees in the region, which were then calibrated against modern records of spring-summer (February-August) self-calibrated Palmer Drought Severity Index (scPDSI), ultimately producing a 319 year long record of drought for the period 1697-2015. The resultant proxy record is displayed in the figure below.
As shown in the figure, there have been multiple periods of severe and moderate drought over the past 300 years, with the most extreme drought of the record occurring in 1707. Power spectrum analysis revealed a number of periodicities in the reconstruction, including drought variability at frequencies of 2-3, 12 and 128 years, which the authors say may well correspond with such well-known oscillations such as ENSO, the Indian Ocean Dipole Mode, North Atlantic Oscillation and the Atlantic Multidecadal Oscillation. Nevertheless, regardless of the force(s) driving drought, there is nothing in the record to suggest that drought is becoming more frequent or more severe over the past century or so in response to rising concentrations of greenhouse gases.
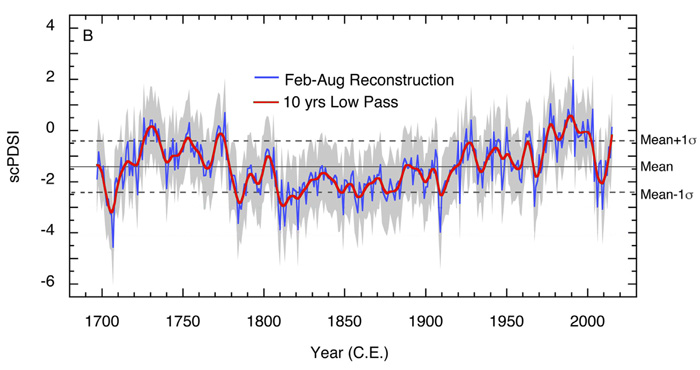
Figure 1. Reconstructed February-August scPDSI (blue line) over the period 1697-2015. A 10-year low pass filter is shown in red. Adapted from Gaire et al. (2019).