


| Tweet | Follow @co2science |
Paper Reviewed
Mo, K.C. and Lettenmaier, D.P. 2018. Drought variability and trends over the central United States in the instrumental record. Journal of Hydrometeorology 19: 1149-1166.
Climate models in general predict that extreme weather events will become more frequent and more severe in the future in response to CO2-induced global warming. Hence, it is important to validate such predictions against the historical record to see whether or not the approximate 40 percent increase in atmospheric CO2 over the past century has had any observational influence on such events thus far. Such analyses can rapidly put to rest claims that a given extreme event (e.g., drought) was caused by anthropogenic climate change; for if it can be shown that events of similar or greater frequencies or magnitudes occurred prior to the majority build-up of greenhouse gases in the atmosphere, then there is no compelling reason not to conclude that the current extreme event is simply the product of natural climate variability.
Such a test was performed recently for drought in the conterminous United States by Mo and Lettenmaier (2018). In their paper, published in the Journal of Hydrometeorology, the two scientists referenced a widespread and severe drought in 2012 that covered more than 62% of the country and caused some $40 billion in damages. And as their contribution to the subject, they investigated this drought event in the context of the past century, seeking to determine if such events are becoming more frequent or more severe.
To accomplish their objective Mo and Lettenmaier used "gridded observed precipitation and reconstructed total moisture percentiles and runoff from four land surface models" to develop an integrated drought index (IDI) for defining drought in the continental USA over the period 1916-2013. Using this resulting index, drought periods were then defined as having an IDI value less than 0.3.
A time series showing the percent of the country meeting the above drought criteria is presented in Figure 1. As illustrated there, it is clear that the frequency and magnitude of droughts are not increasing. In fact, they have decreased over the past century.
Taking their findings a step further, Mo and Lettenmaier next filtered the data presented in Figure 1 to examine severe drought events that covered 50% of the continental USA for a period of six months or longer. Analyses of these data revealed that (1) severe drought events were chiefly located in the central USA, (2) "the 2012 drought event was not unique," considering that there were "16 great drought events in the 98 years of record [they] analyzed," (3) "great droughts occurred less often, and events were less severe as time progressed" and (4) all but two of the 16 great drought events occurred in the first half of the record.
With respect to the potential cause(s) of the 16 great drought events, Mo and Lettenmaier detected a relationship between the Atlantic Multidecadal Oscillation (AMO) and drought (there was a higher percentage of drought when the AMO was in a positive phase) and between ENSO and drought (12 of the 16 great drought events occurred during cold La Niña years). However, droughts did not always occur when the AMO was in a positive phase or when La Niña conditions existed.
The above findings make it abundantly clear that climate model projections of more frequent and more severe drought events are not holding true for the conterminous United States. In contrast, the data reveal a decline in these two parameters over the course of the past half-century.
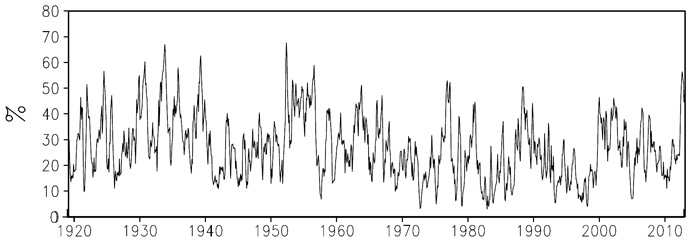
Figure 1. Time series of the percentage of the conterminous United States experiencing drought (IDI index of < 0.3). Source: Mo and Lettenmaier (2018).