


| Tweet | Follow @co2science |
Paper Reviewed
Chen, F., Shang, H. and Yuan, Y. 2016. Dry/wet variations in the eastern Tien Shan (China) since AD 1725 based on Schrenk spruce (Picea schrenkiana Fisch. et Mey) tree rings. Dendrochronologia 40: 110-116.
Droughts are frequently a topic of discussion in the climate change debate. Climate models predict an increase in their frequency and/or intensity in response to CO2-induced climate change. Because atmospheric CO2 concentrations have risen some 45 percent over the past century and a half, and because global temperatures have risen by approximately 0.75°C over this same time period, a natural test of the model-based hypothesis of increasing drought can be conducted by examining long-term historical records of drought to see if they are occurring more frequently or more severely in recent years, as both temperatures and atmospheric CO2 concentrations rose.
One such drought reconstruction that allows for this type of investigation was performed by Chen et al. (2016) for the eastern Tian Shan region of China. Using 372 tree-ring cores taken from 186 Schrenk spruce (Picea schrenkiana) trees, the three researchers were able to develop a 289-year record of the drought (more specifically, a record of Standardized Precipitation Evapotranspiration Index or SPEI). The reconstruction, spanning the years 1725-2013, is shown in the figure below.
As seen in the figure, the SPEI Index displays multiple dry (negative SPEI values) and wet (positive SPEI values) years across the length of the record. Relatively wet periods, identified as those more than one standard deviation unit above the mean, occurred in AD 1725-1728, 1737-1758, 1765-1804, 1829-1834, 1845-1852, 1888-1904, 1915-1923, 1932-1961, 1969-1973 and 1986-2001. In contrast, relatively dry periods (more than one standard deviation below the mean) occurred in AD 1729-1736, 1759-1764, 1805-1828, 1835-1844, 1853-1887, 1905-1914, 1924-1931, 1962-1968, 1974-1985 and 2002-2013; while the most extreme wet and dry years in the record were 1784 and 1928, respectively.
What appears to be absent from the record, however, is any obvious signal of change in the frequency and/or magnitude of drought across the three-century-long reconstruction. Instead, there is nothing unusual, unnatural or unprecedented about the droughts of the past few decades, indicating that rising atmospheric CO2 concentrations are having no measurable impact on drought in the eastern Tian Shan region.
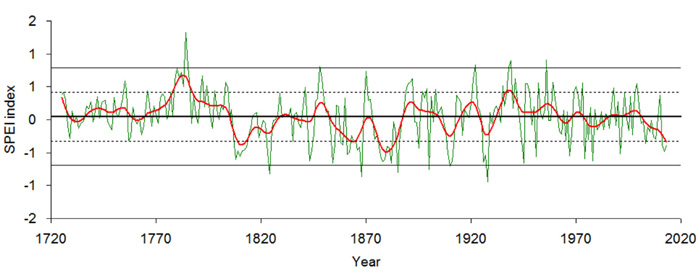
Figure 1. Estimated (green line) and 15-year low-pass filter (red line) SPEI values of eastern Tien Shan. Central horizontal line shows the mean of the estimated values; inner-dotted horizontal lines show the border of one standard deviation, and outer horizontal lines show the border of two standard deviations. Source: Chen et al. (2016).