


| Tweet | Follow @co2science |
Paper Reviewed
Zhang, H., Zhou, G., Liu, D.L., Wang, B., Xiao, D. and He, L. 2019. Climate-associated rice yield change in the Northeast China Plain: A simulation analysis based on CMIP5 multi-model ensemble projection. Science of the Total Environment 666: 126-138.
Writing as background for their work, Zhang et al. (2019) say that "assessing the impacts of future climate change and ensuring future food security under changing climate conditions is one of the most important themes for the 21st century." And in this regard, China is the world's largest producer of rice, producing approximately 30% of the total world-wide. Much of that rice comes from the Northeast China Plain, where rich soils and growing conditions make it one of the most fertile regions for single rice cultivation. Thus there is much interest in how rice yields might be altered in response to global warming and rising atmospheric CO2.
As their contribution to the subject, Zhang et al. used "a well-validated crop model, the CERES-Rice model, driven by future statistically downscaled daily climate data from 28 GCMs for phase five of the Coupled Model Intercomparison Project (CMIP5) under two representative concentration pathway (RCP) scenarios, RCP4.5 and RCP8.5, to project impacts of future climate change on rice yield in the Northeast China Plain [NECP]" for three future time periods: the 2030s (2021-2040), the 2060s (2051-2070), and the 2090s (2081-2100). Mean temperatures in this region, according to the RCP4.5 scenario, were projected to rise by 0.7-0.9°C, 1.3-1.7°C, and 1.6-2.0°C in the 2030s, 2060s and 2090s, respectively, and by 0.8-1.1°C, 2.1-2.6°C and 3.4-4.4°C in the RCP8.5 scenario.
And what did the model projections reveal?
The impact of the predicted temperature increase in the RCP4.5 scenario -- without including the effects of rising CO2 -- produced a meager 1.3% increase in rice yields in the 2030s, a 1.3% increase in the 2060s and a 0.4% increase in the 2090s. In the RCP8.5 scenario, and once again without including the impacts of CO2, the models projected a yield gain of 1.1% in the 2030s, which turned to yield declines in the 2060s and 2090s of 2.3% and 10.7%, respectively.
A quite different outlook was presented when the authors included the growth-enhancing effects of atmospheric CO2 enrichment in the model. In the RCP4.5 scenario, rice yields increased by 5.4%, 10.0% and 11.6% during the 2030s, 2060s and 2090s, respectively, while in the RCP8.5 scenario they increased by 6.4% (2030s), 12.9% (2060s) and 15.6% (2090s).
In light of the above, Zhang et al. conclude that, in the future, "CO2 fertilization effects [will] predominate over the effects of climate change in the middle and late 21st century, with benefits for rice yields." Yet such projections are likely very conservative. Consider, for example, the fact that the models consistently have over predicted the warming of the past four decades by a factor of two or more. Furthermore, consider the additional fact that several rice genotypes have been shown to be highly sensitive to atmospheric CO2 enrichment, producing a doubling of yield or more if CO2 concentrations rise to the levels predicted in the RCP8.5 scenario by the end of the century. This combination of a reduction in predicted warming and the possibility to select rice cultivars that produce a much greater yield response to rising atmospheric CO2, suggests that farmers may well be able to witness incredible and sustained future rice yields throughout the entire 21st century and beyond!
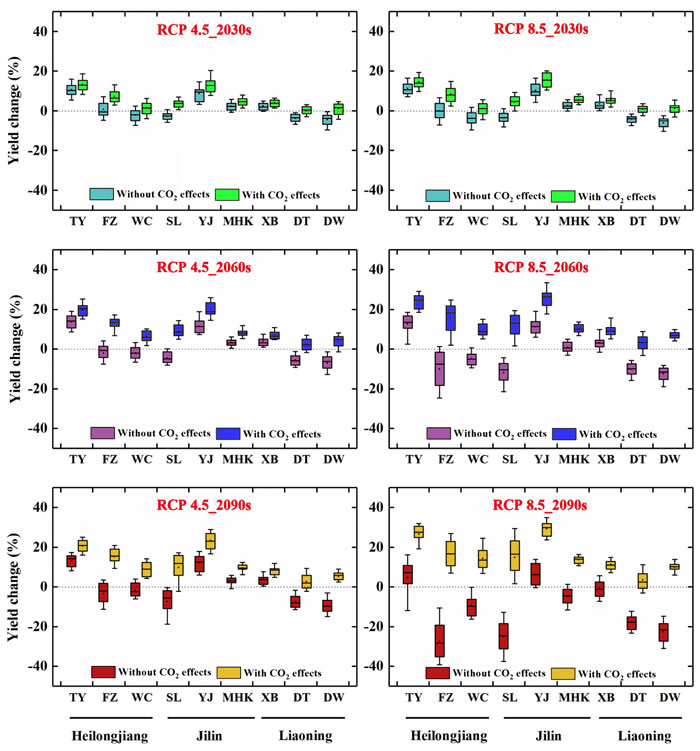
Figure 1. Simulated rice yield change (compared with baseline 1991-2010) in the 2030s, 2060s, and 2090s under representative concentration pathway (RCP) 4.5 and 8.5 scenarios using 28 global climate models (GCMs) for nine stations in the Northeast China Plain. The box boundaries indicate the 25th and 75th percentiles; the black line and dot within the box mark the median and mean, respectively; and whiskers below and above the box indicate the 10th and 90th percentiles, respectively. Source: Zhang et al. (2019).