| Tweet | Follow @co2science |
Paper Reviewed
Kumari, M., Verma, S.C. and Bhardwaj, S.K. 2019. Effect of elevated CO2 and temperature on growth and yield contributing parameters of pea (Pisum sativum L.) crop. Journal of Agrometeorology 21: 7-11.
According to Kumari et al. (2019), pea (Pisum sativum) is the most widely produced and consumed vegetable in Himachal Pradesh, India. In light of such agricultural prominence, this team of three researchers set out to investigate the impact of increasing CO2 concentrations and temperature on future pea growth and yield.
Their work was conducted in open-top chambers across two growing seasons for two pea cultivars, cv. Azad P-1 and cv. PB-89. CO2 treatments included ambient (381 ppm) or enriched (550 ppm) and temperature treatments included ambient (23.55°C) or ambient +1°C. And what did the study reveal?
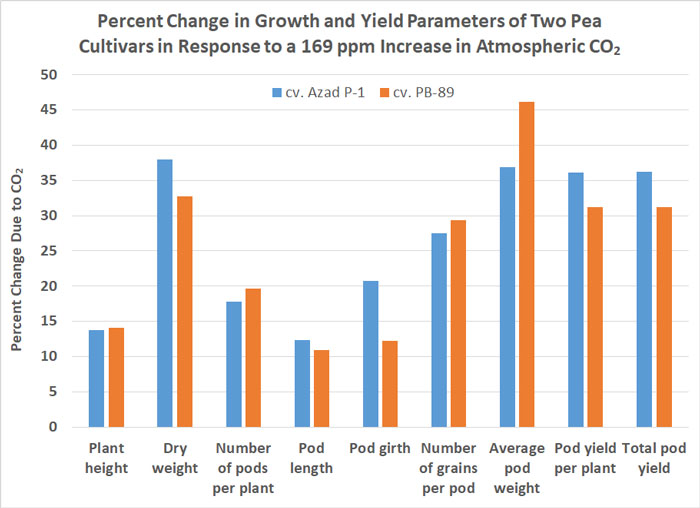
Not surprisingly, elevated CO2 had a positive impact on various growth and yield-related parameters, as illustrated in Figure 1 below. In particular, and averaged for both cultivars, the small 169 ppm increase in CO2 increased plant height by 13.9%, dry weight by 35.4%, number of pods per plant by 18.7%, pod length by 11.6%, pod girth by 16.5%, number of grains per pod by 28.4%, average pod weight by 41.5%, pod yield per plant by 33.7% and total pod yield by 33.7%. The magnitude of such CO2-induced enhancements, however, were somewhat reduced in the combined elevated CO2 and elevated temperature treatment, though they all remained positive with growth and yield parameter enhancements ranging from 6% to 33% (relative to that observed under ambient CO2 and ambient temperature conditions). Consequently, it would appear that pea farmers and consumers in Himachal Pradesh will benefit from future CO2-induced increases in pea growth and yield, regardless of whether or not the CO2 rise is accompanied by a rise in temperature.

Figure 1. Percent change in various growth and yield-related parameters of two pea cultivars in response to a 169 ppm increase in atmospheric CO2. Data presented in this graphic were derived from Table 1 and Table 2 of Kumari et al. (2019).


