


| Tweet | Follow @co2science |
Paper Reviewed
Yuan, S., Zheng, Y., Wu, S., Xu, P., Zhang, F. Kong, F., Qi, Y. and Wang, D. 2018. March SST reconstruction in the South China Sea based on Pinus massoniana tree-ring widths from Changting, Fujian, in Southeast China since 1893 CE. Marine Micropaleontology 145: 21-27.
According to Yuan et al. (2018), "studies examining sea surface temperature variability over the past one century and their influence on climate change in China are seriously lacking." And therefore, in an effort to remedy this information void, the team of eight Chinese scientists developed "the first tree-ring-based dendroclimatic sea surface temperature (SST) reconstruction for the South China Sea."
In accomplishing their objective Yuan et al. cored 22 Pinus massoniana trees in the Changting Region of the Fujian Province, China. Analysis of the cores revealed a statistically significant relationship between the tree-ring series and gridded March SSTs (1°C resolution) of the South China Sea (16-20°N, 112-116°E). Ultimately, this relationship enabled them to produce a proxy temperature reconstruction over the period 1893-2011, which reconstruction is shown below.
As indicated in Figure 1, above-average temperatures occurred in 1904-1913, 1929-1948, 1961-1973 and 1991-2006. Below-average temperatures, on the other hand, occurred in 1914-1925, 1949-1960, 1979-1990 and 2007-2011. What is particularly insightful about the reconstruction, however, is the absence of any apparent anthropogenic influence on the 119-year record of SST variability. In fact, there appears to be nothing unusual, unnatural or unprecedented about current temperatures. Indeed, temperatures of the past four decades have remained relatively stable over the whole length of the record.
Consequently, in light of the above findings, it would appear that the proxy temperature record of the South China Sea does not support the narrative that rising atmospheric CO2 is causing dangerous climate change.
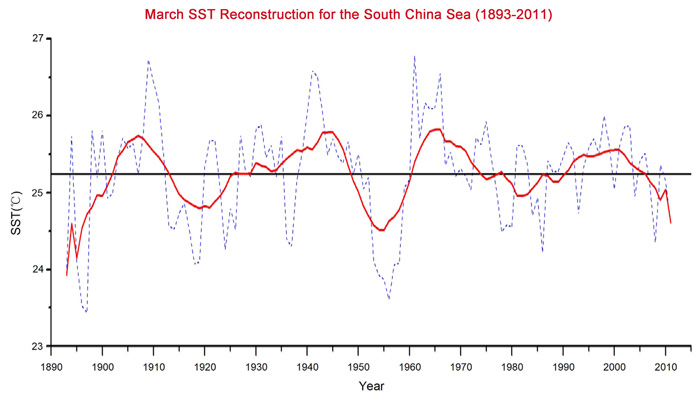
Figure 1. March sea surface temperature (SST) reconstruction (1893-2011) for the South China Sea. The blue dashed line represents the reconstruction, the red solid curve is an 11-year running mean of the reconstructed SST. Source: Yuan et al. (2018).