


| Tweet | Follow @co2science |
Paper Reviewed
Asteman, I.P., Filipsson, H.L. and Nordberg, K. 2018. Tracing winter temperatures over the last two millennia using a north-east Atlantic coastal record. Climate of the Past 14: 1097-1118.
In providing the rationale for their work, Asteman et al. (2018) say that "to evaluate how significant regional climate changes are or if observed temperature anomalies are unprecedented in view of long-term climate evolution, there is a need for historical instrumental climate records." And recognizing the importance of the North Atlantic region in this regard, the three scientists set out to reconstruct "a bottom water temperature proxy record for Gullmar Fjord, on the west coast of Sweden, which illustrates the climate development in north-western Europe over the last ~2500 years.
The reconstructed record was based on stable oxygen isotopes obtained from shallow infaunal foraminifers in two sediment cores of the fjord. A significant contribution of this work was a high temporal (annual to sub-decadal) resolution across the length of the proxy. In addition, a second strength was the fact that their proxy provided a record of winter temperatures (most proxies are summer-based). The 2500-year bottom water record is shown below.
In commenting on the record, Asteman et al. first note that "the reconstructed temperature range (2.7-7.8 °C) is within the present-day annual variability, documented from instrumental temperature measurements in the fjord's deepest basin since 1890." Next, they point out that "the Gulmar Fjord winter bottom water temperature record shows both centennial and multidecadal variability and has a striking resemblance to climate periods historically known in northern Europe over the last 2500 years." Those periods include the Roman Warm Period (RWP), Dark Ages Cold Period (DACP), Medieval Warm Period (MWP), Little Ice Age (LIA) and Current Warm Period (CWP).
According to Asteman et al., temperatures during the RWP (prior to ~ AD 450) were approximately 2.5 °C higher than the 1961-1999 mean, encompassing a temperature range of 5.4-7.9 °C. During the DACP (~ AD 450-850), temperatures were more variable but stayed in the range of 4-8 °C. The MWP, which the authors say occurred around AD 850-1350, coincided with a grand solar maximum with water temperatures ranging between 5.4 and 7.6 °C. Thereafter, temperatures cooled once again during the LIA, with bottom water temperature averaging 2-3 °C lower than the instrumental 1961-1999 temperature mean and hovering between a range of 2.9 to 6.6 °C.Finally, at the end of the record, temperatures warmed up again. However, Asteman et al. report that the contemporary warming of the 20th century "does not stand out in the 2500-year perspective and is of the same magnitude as the Roman Warm Period and the Medieval Climate Anomaly."
In light of all of the above, it is clear that there is nothing unusual, unnatural, or unprecedented about 20th century warmth, which reality is far different from the cries of the alarmists who claim current temperatures are unprecedented due to rising levels of atmospheric CO2. Clearly, the record indicates they are not.
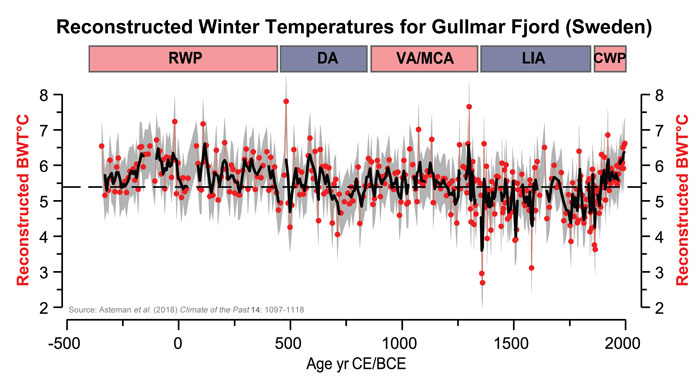
Figure 1. Reconstructed winter bottom water temperatures (BWT) from Gullmar Fjord, Sweden. The thick black line shows a 3-point running mean and the dashed line indicates the mean instrumental bottom water temperatures between 1961 and 1990 (5.4°C). Abbreviations are as follows: RWP = Roman Warm Period, DA = Dark Ages Cold Period, VA/MCA = the Viking Age/Medieval Climate Anomaly, LIA = Little Ice Age and CWP = the Current Warm Period. Source: Adapted from Asteman et al. (2018).