


| Tweet | Follow @co2science |
Paper Reviewed
Barral, A., Gomez, B., Fourel, F., Daviero-Gomez, V. and Lécuyer, C. 2017. CO2 and temperature decoupling at the million-year scale during the Cretaceous Greenhouse. Scientific Reports 7: 8310, DOI: 10.1038/s41598-017-08234-0.
Writing as background for their work, Barral et al. (2017) say that "CO2 is considered the main greenhouse gas involved in the current global warming and the primary driver of temperature throughout Earth's history." However, they continue, "the soundness of this relationship across time scales and during different climate states of the Earth remains uncertain." And given such uncertainty, the team of five French researchers set out to "explore how CO2 and temperature are related in the framework of a Greenhouse climate state of the Earth," namely, the Cretaceous period of approximately 80 to 130 million years ago.
In doing so, the authors utilized carbon isotope compositions from fossil samples of the conifer Frenelopsis, which they compared with the historic sea surface temperature record of Martin et al. (2014). The resultant comparison is depicted in the figure below.
As revealed in the figure, Barral et al. report that pCO2 during the warm mid Cretaceous was in the range of 150-650 ppm, which value they say is "far less than what is usually considered for [this interval]." Another intriguing finding was the "drastic Myr-scale pCO2 drawdowns [that] took place during the warmest time intervals described for the Cretaceous (Martin et al., 2014; Mutterlose et al. 2014; Naafs et al. 2016): a drawdown of ca. 310 ppm (from ca. 500 to ca. 190 ppm) during the upper Barremian-lower Aptian interval (ca. 7.5 Myr), and ca. 225 ppm (from ca. 410 ppm to ca. 190 ppm) during the upper Albian-lower Cenomanian interval (ca. 5 Myr)." What is more, they report that, "at the Myr-scale, trends in pCO2 are even inverse compared to temperature during significant time intervals such as the upper Barremian-lower Aptian (considering the higher resolution temperature curves based on TEX86 proxy; Mutterlose et al. 2014; Naafs et al. 2016) and the upper Albian-Santonian in which pCO2 minima are coeval with thermal maxima." Consequently, Barral et al. conclude that "if pCO2 was rather low and usually decoupled from temperature at the Myr-scale, it may not have been the main long-term driver of global warming during the Cretaceous.
Indeed, and considering all the many other examples that exist in the peer-reviewed scientific literature of a decoupling of atmospheric CO2 and temperature (see CO2-Temperature Correlations in our Subject Index), there is ample reason to conclude that CO2 is but a bit player among the many factors influencing climate change.
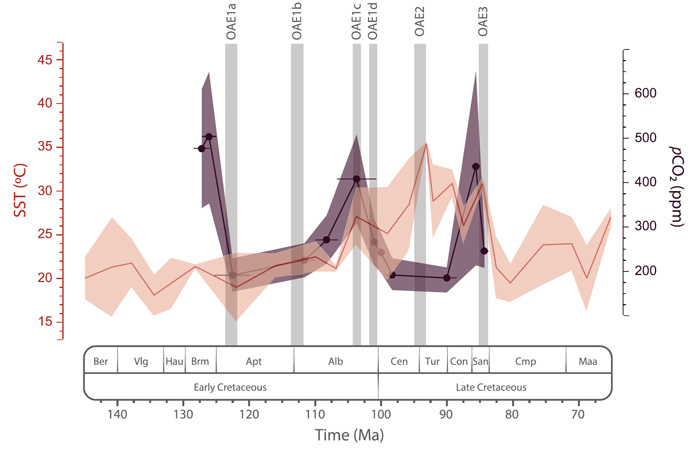
Figure 1. Reconstructed pCO2 (purple line and shading) compared with the sea surface temperature (SST; orange line and shading) record of Martin et al. (2014) for the Cretaceous. Vertical grey bars represent major Oceanic Anoxic Events (OAE) occurring during the Cretaceous. Envelopes represent ± 1σ. Adapted from Barral et al. (2017).
References
Martin, J.E., Amiot, R., Lécuyer, C. and Benton, M.J. 2014. Sea surface temperature contributes to marine crocodylomorph evolution. Nature communications 5: Article number 4658.
Mutterlose, J., Bottini, C., Schouten, S. and Damsté, J.S.S. 2014. High sea-surface temperatures during the early Aptian Oceanic Anoxic Event 1a in the Boreal Realm. Geology 42: 439-442.
Naafs, B.D.A. and Pancost, R.D. 2016. Sea-surface temperature evolution across Aptian Oceanic Anoxic Event 1a. Geology 44: 959-962.
Posted 6 September 2018