


| Follow @co2science |
Paper Reviewed
Davis, W.J. 2017. The relationship between atmospheric carbon dioxide concentration and global temperature for the last 425 million years. Climate 5: 76; doi: 10.3390/cli5040076.
Writing by way of introduction to his work, Davis (2017) notes that "a central question for contemporary climate policy is how much of the observed global warming is attributable to the accumulation of atmospheric CO2 and other trace greenhouse gases emitted by human activities." If you talk to a climate alarmist, the answer you receive from such an inquiry will likely be "almost all." A climate skeptic, on the other hand, will likely respond that the answer is "likely none."
Hoping to provide some crucial information on this topic, Davis analyzed the relationship between historic temperature and atmospheric CO2 using the most comprehensive assemblage of empirical databases of these two variables available for the Phanerozoic period (522 to 0 million years before present; Mybp). In all, 6680 proxy temperature and 831 proxy CO2 measurements were utilized, enabling what Davis described as "the most accurate quantitative empirical evaluation to date of the relationship between atmospheric CO2 concentration and temperature." Multiple statistical procedures and analyses were applied to the proxy records and the resultant relationship is depicted in the figure below.
As noted by the author, the most striking observation from the visual comparison is the "apparent dissociation and even an antiphasic relationship" among the two variables. For example, Davis reports that, (1) "a CO2 concentration peak near 415 My occurs near a temperature trough at 445 My," (2) "similarly, CO2 concentration peaks around 285 Mybp coincide with a temperature trough at about 280 My and also with the Permo-Carboniferous glacial period (labeled 2 in [the] Figure)," (3) "the atmospheric CO2 concentration peak near 200 My occurs during a cooling climate, as does another, smaller CO2 concentration peak at approximately 37 My," (4) "the shorter cooling periods of the Phanerozoic, labeled 1-10 in [the] Figure, do not appear qualitatively, at least, to bear any definitive relationship with fluctuations in the atmospheric concentration of CO2" (emphasis added), (5) "regression of linearly-detrended temperature proxies against atmospheric CO2 concentration proxy data reveals a weak but discernible negative correlation between CO2 concentration and temperature," and (6) "the percent of variance in temperature that can be explained by variance in atmospheric CO2 concentration, or conversely, R2 x 100, is 3.6%, [indicating that] more than 95% of the variance in temperature is explained by unidentified variables other than the atmospheric concentration of CO2."
In light of these several important findings (or lack thereof), Davis concludes that his analysis "demonstrates that changes in atmospheric CO2 concentration did not cause temperature change in the ancient climate," which findings, he adds, "corroborate the earlier conclusion based on study of the Paleozoic climate that 'global climate may be independent of variations in atmospheric carbon dioxide concentration" (Came et al., 2007).
One final gem from Davis' work is a pronouncement that follows a discussion on the lack of correlation between CO2 and temperature across the historical record, where he aptly reminds us that "correlation does not imply causality, but the absence of correlation proves conclusively the absence of causality." Consequently, there should be no more doubt regarding the ineffectiveness of atmospheric CO2 to control or drive climate change. It is simply nothing more than a bit player, whose influence has been continually overestimated by climate alarmists. The big question now is whether or not 500 million years of these data will convince them otherwise!
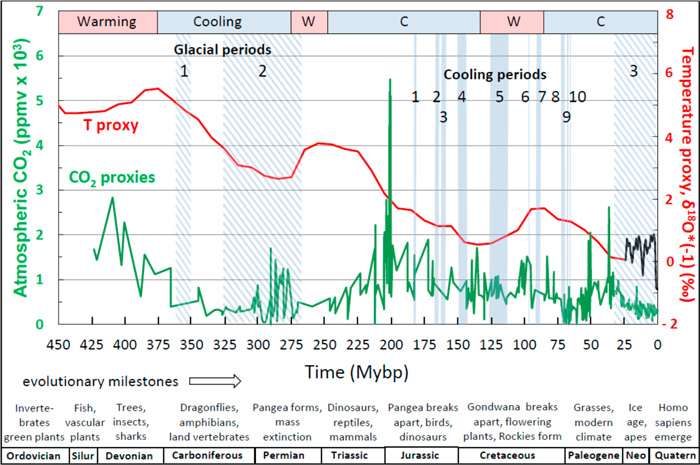
Figure 1. Temperature (T, red line) and atmospheric carbon dioxide (CO2, green line) concentration proxies during the Phanerozoic Eon. Glaciations based on independent sedimentary evidence are designated by vertical blue cross-hatched areas, while putative cool periods are designated by vertical solid blue bars. Major cooling and warming cycles are shown by the colored bars across the top while geological periods and evolutionary milestones are shown across the bottom. Abbreviations: Silu, Silurian; Neo, Neogene; Quatern, Quaternary. The three major glacial periods and ten cooling periods identified by blue cross-hatches and solid lines, respectively, are: Glacial periods. 1. late Devonian/early Carboniferous; 2. Permo-Carboniferous; 3. late Cenozoic. Cooling periods. 1. late Pliensbachian; 2. Bathonian; 3. late Callovian to mid-Oxfordian; 4. Tithonian to early Berriasian; 5. Aptian; 6. mid-Cenomanian; 7. mid-Turonian; 8. Campanian-Maastrichtian boundary; 9. mid-Maastrichtian; 10. late-Maastrichtian. Source: Davis (2017).
Reference
Came, R.E., Eller, J.M., Veizer, J., Azmy, K., Brand, U. and Weldman, C.R. 2007. Coupling of surface temperatures and atmospheric CO2 concentrations during the Paleozoic era. Nature 449: 198-201.