


| Tweet | Follow @co2science |
Paper Reviewed
Fountain, A.G., Glenn, B. and Scambos, T.A. 2017. The changing extent of the glaciers along the western Ross Sea, Antarctica. Geology 45: 927-930.
Climate alarmists have long anticipated Earth's polar regions to symbolize the proverbial canary in the coal mine when it comes to witnessing the impacts of CO2-induced climate change. In these high latitudes, temperatures are predicted to warm so fast and to such a degree so as to cause unprecedented melting of ice that even the most ardent of climate skeptics would be forced to concede the verity of global warming theory. Consequently, researchers pay close attention to changes in climate in both the Arctic and Antarctic.
The most recent work in this regard comes from the scientific team of Fountain et al. (2017), who analyzed changes in glacier extent along the western Ross Sea in Antarctica over the past 60 years. More specifically, using digital scans of paper maps based on aerial imagery acquired by the U.S. Geological Survey, along with modern-day satellite imagery from a variety of platforms, the authors digitized a total of 49 maps and images from which they calculated changes in the terminus positions, ice speed, calving rates and ice front advance and retreat rates from 34 glaciers in this region over the period 1955-2015.
In discussing their findings, Fountain et al. report that "no significant spatial or temporal patterns of terminus position, flow speed, or calving emerged, implying that the conditions associated with ice tongue stability are unchanged," at least over the past six decades. However, they also report that "the net change for all the glaciers, weighted by glacier width at the grounding line, has been [one of] advance" (emphasis added) with an average rate of increase of +12 ± 88 m yr-1 (see Figure 1 below).
In pointing out the significance of the above findings, it is important to note that, over a period of time in which the bulk of the modern rise in atmospheric CO2 has occurred, not only have the majority of glaciers from this large region of Antarctica not retreated, they have collectively grown! This stark reality stands in direct contrast to climate-alarmist predictions for this region; and it reveals that if there is any canary in the coal mine to be seen, it is in the failure of global warming predictions/theory to match real-world observations. What will it take for climate alarmists to concede this fact?
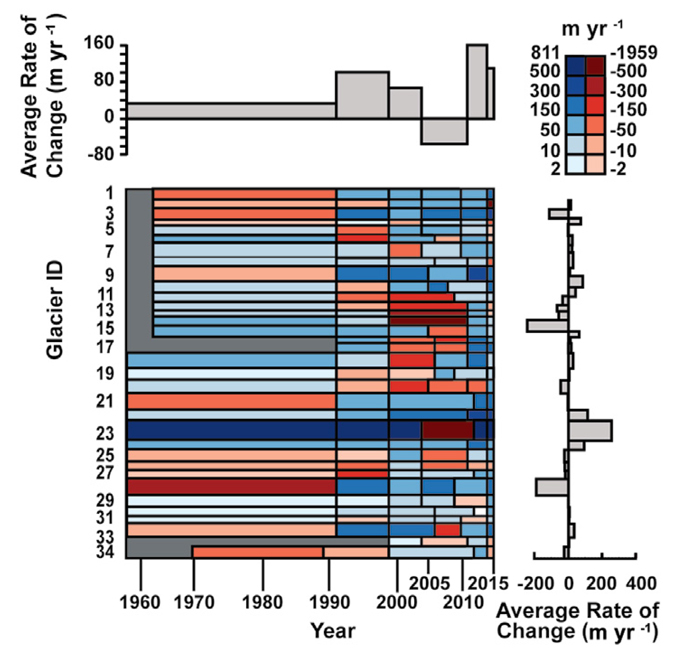
Figure 1. Advance (blue) or retreat (red) rate (m yr-1) of glaciers along west coast of Ross Sea (Antarctica). Time intervals are defined by available maps and imagery. The top graph presents the average change over time for all glaciers in the study, weighted by glacier width at grounding line. Because time intervals for individual glaciers are not identical, the authors used periods with the most glacier measurements. The main colored graphic shows change in glaciers from north (glacier ID 1) to south (ID 34) with time. Row height along y-axis is presented as the glacier area normalized by area of David Glacier-Drygalski Ice Tongue (ID 23, the largest glacier) using a logarithmic scale. Gray shading indicates no data. Finally, the graph at lower right presents the average advance or retreat rate over the entire period of measurement for each glacier. Source: Fountain et al. (2017).