


| Tweet | Follow @co2science |
Paper Reviewed
Deng, Y., Gou, X., Gao, L., Yang, M. and Zhang, F. 2017. Spatiotemporal drought variability of the eastern Tibetan Plateau during the last millennium. Climate Dynamics 49: 2077-2091.
Climate alarmists typically contend that in response to global warming, extreme weather events such as drought will become more frequent and severe. It is therefore important to determine if long-term precipitation data from various places throughout the world provide any evidence for this contention.
The latest work to shed some light on this subject comes from Deng et al. (2017), who prepared a millennium-long drought history for the eastern Tibetan Plateau (ETP). This was accomplished through statistical examination of 118 tree-ring chronologies situated within the latitude/longitude region of 25-44°N and 88-107°E, which rings were found to correlate well with an index of summer (May-July) moisture (the Standardized Precipitation Evapotranspiration Index, SPEI, a multi-scalar drought index frequently used in climate studies). However, due to a lack of data in the southern portion of their study area prior to AD 1300, the ETP region was subdivided to create two separate SPEI proxies: one north of 32°N covering the period from approximately AD 600 to AD 2000, and one south of 32°N that extended from approximately AD 1350 to AD 2000.
The resultant reconstructions are presented in Figure 1 below. As seen there, both reconstructions reveal the presence of multidecadal to centennial changes in moisture. In the northern ETP record, relatively dry periods occurred during AD 670-810, 1100-1200, 1260-1300, 1440-1500, and 1640-1730, whereas relatively wet periods persisted during AD 830-390, 960-1100, 1220-1250, 1320-1430, 1520-1580, 1600-1630 and 1740-1910. In the southern ETP reconstruction, drier conditions occurred during both the fifteenth and seventeenth centuries, while a wetter climate prevailed in the sixteenth century and from the early eighteenth century to the mid-nineteenth century.
Probably the most pertinent observation, however, is that neither the north or south reconstruction of the ETP show unusual, unnatural or unprecedented moisture conditions over the most recent century, during which time the CO2 content of the atmosphere rose by more than 40 percent. Despite this increase, there appears to be no discernible impact on drought or flood, which climatic features presently remain well within the bounds of their multi-century records. In contrast, what does appear to influence drought/flood variation in the ETP is solar variability, as statistical comparisons between the SPEI reconstructions and a 10Be and 14C based solar activity records revealed that droughts corresponded with periods of solar minima and floods with periods of solar maxima.
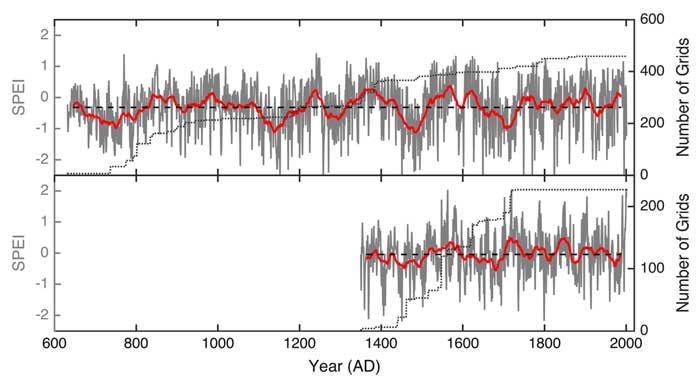
Figure 1. Regional drought reconstructions of the north (upper) and south (lower) portion of the eastern Tibetan Plateau study area, and their 31-year running averages (red lines). The temporal change in the number of grids used comprise the regional mean, which is shown in a dashed line in each panel. Source: Deng et al. (2017).