


| Tweet | Follow @co2science |
Paper Reviewed
Brans, K.I., Jansen, M., Vanoverbeke, J., Tüzün, N., Stoks, R. and De Meester, L. 2017. The heat is on: Genetic adaptation to urbanization mediated by thermal tolerance and body size. Global Change Biology 23: 5218-5227.
One of the great ecological concerns surrounding the global warming debate is the ability (or perhaps non-ability) of plant and animal species to both cope with and adapt to the predicted future temperature increases anticipated to occur in response to rising concentrations of greenhouse gases. In this regard, climate alarmists contend that such warming is likely to be too rapid or too severe, and that its negative impacts will push numerous species toward extinction. Climate skeptics, on the other hand, argue that the predicted temperature increases are too large and unlikely to occur. They also maintain that plants and animals have inherent capabilities that will allow them to adapt and evolve to the challenges faced by even the most extreme predictions of future global warming, thus ensuring their continuance. This latter hypothesis of adaptation/evolution was the subject of a recent investigation by Brans et al. (2017).
Working with thirteen population samples of Daphnia magna, twelve from across a rural-urban gradient of ponds in the Flanders, Belgium area and one from the highly urbanized city center of Brussels, the team of six researchers cultured the specimens at one of two temperatures (20 or 24°C) in a controlled environment laboratory for one generation. At maturity, the temperature of each culture was raised by 1°C every 20 seconds to determine the critical thermal maximum (CTMAX), which parameter they defined as the temperature at which the animals stopped swimming and sank to the bottom of the container. Adaptation (phenotypic plasticity) in response to increasing temperature would be evident if the D. magna populations reared at 24°C experienced a higher thermal tolerance (i.e., CTMAX) than those reared at 20°C. Evolutionary change would be evident if the degree of temperature adaptation differed by level of urbanization associated with the thirteen D. magna populations. So what did the study reveal?
As depicted in the figure below, the thermal tolerance (measured as CTMAX) of this keystone freshwater grazer increased with the level of urbanization. It was also higher at the warmest rearing temperature (the 24°C rearing temperature induced a thermal tolerance that was on average 1.25°C greater than that observed at a 20°C rearing temperature). Furthermore, statistical analyses, in the words of the authors, confirmed that there was indeed "a direct positive effect of both urbanization level and rearing temperature on thermal tolerance," such that "urbanization level (reflecting evolutionary trait change) and rearing temperature (reflecting phenotypic plasticity) accounted for 38.64% and 57.11% of the total increase in CTMAX, respectively."
Commenting on their work, Brans et al. say that their findings "provide solid proof that Daphnia can evolutionarily track environmental warming, not only along large-scale temperature gradients or through time, but also along smaller scale spatial disturbance gradients such as the urbanization gradients studied here." As a result, both urban and rural Daphnia populations should have little problem coping with future warming. And if this keystone freshwater grazer can respond in this manner, reason suggests that other plants and animals should have the capability to do so as well.
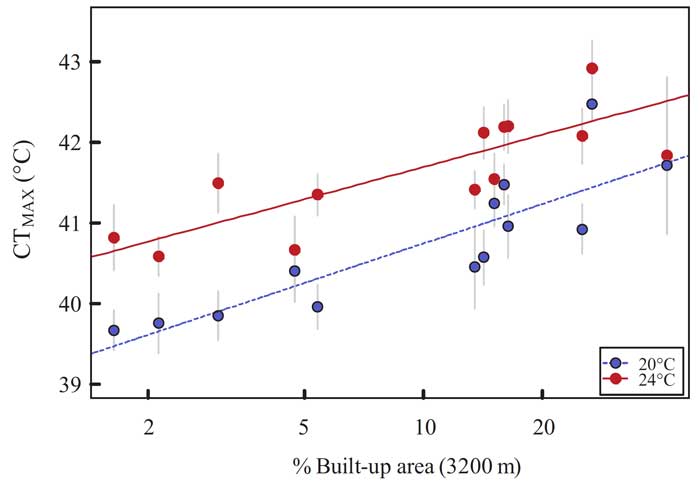
Figure 1. Average critical thermal maxima (CTMAX) plotted against the level of urbanization (% Built-up area) for 13 Daphnia magna populations. Data are presented as population means ± 1 SE when reared at 20°C (blue circles and dashed line) and at 24°C (red symbols and solid line). The urbanization level is plotted as percentage built-up area (+ 1, log-scale) within a radius of 3200 m around each sampling location. Regression lines are given for both rearing temperatures based on the slope in the mixed model. Source: Brans et al. (2017).