


| Tweet | Follow @co2science |
Paper Reviewed
Pardew, J., Pimentel, M.B. and Low-Decarie, E. 2018. Predictable ecological response to rising CO2 of a community of marine phytoplankton. Ecology and Evolution 8: 4292-4302.
As the modern investigation into the potential impacts of so-called ocean acidification on marine life continues, one narrative is beginning to emerge across the scientific literature, which is that rising atmospheric CO2 concentrations will likely benefit the growth of primary producers.
The latest support for this coalescing conclusion is depicted in the graphic below, where Pardew et al. (2018) depict the growth responses of seven phytoplankton species from four major taxons to elevated levels of seawater pCO2. Each of the species was grown under controlled-environment conditions under either ambient (~500 µatm) or elevated (~1,000 µatm) pCO2 in either a high-nitrogen or low-nitrogen culture medium.
As reported by Pardew et al., the growth rates of all species "increased with high CO2 independent of culture regime, where on average an increase of 0.12 ± 0.07 per day was observed in phytoplankton exposed to high CO2 compared to ambient conditions" (p < 0.001). And in regard to this observation, the three scientists say that "this contrasts with expectations based on nutrient limitation in natural marine phytoplankton communities, where the main limiting resources are usually nitrogen and iron."
While it remains to be seen exactly how these findings will hold out in the real world of the dynamic ocean, the picture painted by this study is quite different from that sold to the public by climate alarmists, who consistently claim that so-called ocean acidification is detrimental to marine life.
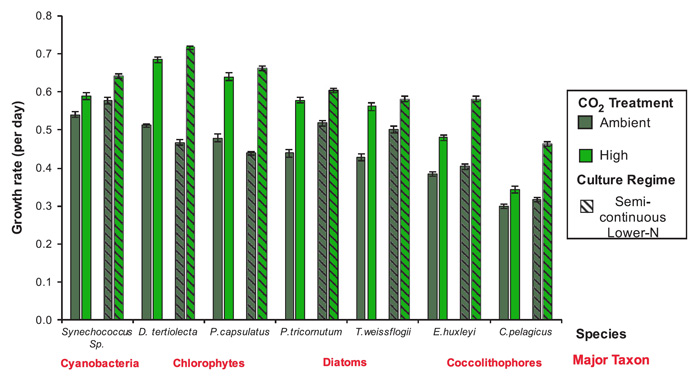
Figure 1. Phytoplankton growth rates across CO2 and culture regimes. Plain bars are batch high nitrogen conditions (high and low CO2), bars with stripes are semi-continuous lower nitrogen conditions (high and low CO2), dark green bars are ambient CO2 (~500 µatm), and light green bars are high CO2 (~1,000 µatm). Each bar shows mean values with ± 1 standard deviation (N = 12). All species had higher growth rates in high CO2 compared to low CO2 independent of culture regime. Source: Pardew et al. (2018).