


| Tweet | Follow @co2science |
Paper Reviewed
Sun, C., Liu, Y., Song, H., Mei, R., Payomrat, P., Wang, L. and Liu, R. 2018. Tree-ring-based precipitation reconstruction in the source region of Weihe River, northwest China since AD 1810. International Journal of Climatology 38: 3421-3431.
Mt. Shouyang (34.99°N, 104.24°E, 2,350 m) is located in a forested area in the southern region of Weiyuan County, northwest China. In 2015, Sun et al. (2018) collected 40 tree-ring cores from 20 healthy purple cone spruce (Picea purpurea) trees located on the mountain in an effort to create a long-term precipitation record that would better define climate variability in this region beyond the existing instrumental record. The ensuing reconstruction is presented in the figure below, covering the years 1810-2014.
As indicated, the 205-year record contains multiple wet and dry events. In all, there were 33 dry and 28 wet years over the period of study, identified as annual values that were plus (for wet) or minus (for dry) one standard deviation from the long-term mean. Multi-taper spectral analysis of the reconstruction further revealed the presence of multiple periodicities within the record, with cycles at 2-8, 15.9 and 18.6 years, which the authors concluded were likely the products of ENSO (the 2- to 8-year periodicities) and the North Atlantic Oscillation (the 15.9- and 18.6-year cycles).
Interestingly, what appears to be absent from the reconstruction is any evidence of a wetting or drying trend across the length of the two-century record. Rather, there is nothing unusual, unnatural or unprecedented in this long-term data set. Consequently, it would appear that no forcing (including the 40% modern rise in atmospheric CO2) has been of sufficient magnitude to drive long-term precipitation change on Mt. Shouyang.
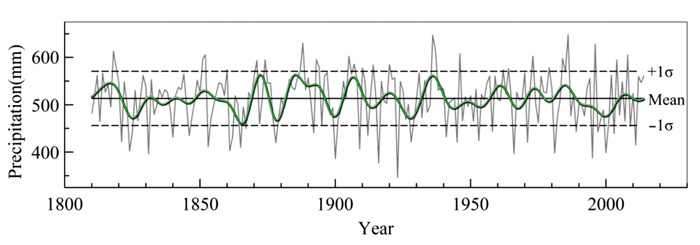
Figure 1. Mt. Shouyang precipitation reconstruction for the period 1810-2014. The green line denotes a 10-year low-pass filter and the horizontal lines denote the mean and mean ± one standard deviation. Source: Sun et al. (2018).