| Tweet | Follow @co2science |
Paper Reviewed
Shibuya, T., Kano, K., Endo, R. and Kitaya, Y. 2018. Effects of the interaction between vapor-pressure deficit and salinity on growth and photosynthesis of Cucumis sativus seedlings under different CO2 concentrations. Photosynthetica 56: 893-900.
Salinity, moisture and atmospheric carbon dioxide concentration are three environmental parameters that can significantly impact plant growth. Yet much remains to be learned about their interactive effects.
In a study designed to investigate the combined influence of these three variables, Shibuya et al. (2018) grew cucumber (Cucumis sativus, cv. Hokushin) seedlings for eight days in a controlled-environment chamber at two atmospheric CO2 levels, two vapor pressure deficits and two salinity levels. The growth substrate was a hydroponic medium with an applied nutrient solution that differed in salinity level (0 mM or 34 mM NaCl, corresponding to low and high salinity). Vapor pressure deficits (VPD) in the chambers were maintained at relative humidity levels of 90% (low VPD) or 20% (high VPD) for an air temperature of 28°C and atmospheric CO2 levels were kept at 400 ppm (ambient) or 1,000 ppm (elevated).
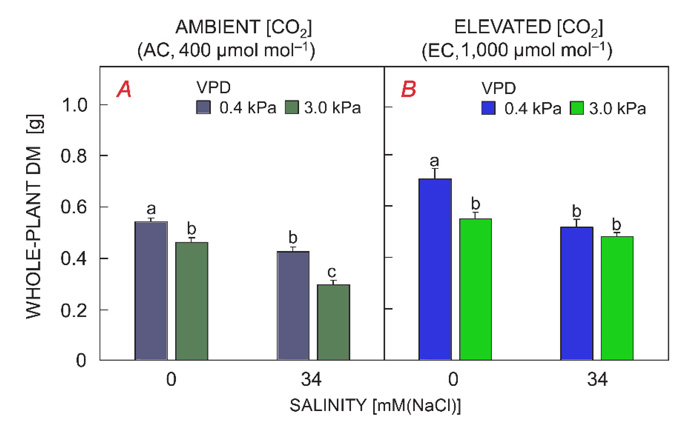
Not surprisingly, as shown in the figure below, the results indicated that plant growth declined at both higher VPD and higher salinity levels, which conditions negatively impacted plant photosynthesis. Elevated CO2, in contrast, increased plant photosynthesis and growth, fully ameliorating the negative impacts of VPD and salinity (compare the plant dry matter values in panel B under elevated CO2 conditions with the plant dry matter values under ambient CO2 in panel A). Thus, in the future, if the air gets a little dryer or soils a little saltier, as long as the air's CO2 content continues to rise, cucumber growth should be maintained or increase relative to that of today.

Figure 1. Whole-plant dry mass (DM) of cucumber (Cucumis sativus) grown under different combinations of vapor-pressure deficit, salinity of the nutrient solution, and atmospheric CO2 concentration ([CO2]; [A] ambient [CO2], AC, and [B] elevated [CO2], EC) for 8 days after transplantation. At a given [CO2], mean values labelled with different letters differed significantly between treatments (Tukey-Kramer test, P < 0.05). Source: Shibuya et al. (2018).


