


| Tweet | Follow @co2science |
Paper Reviewed
Chen, F., Mambetov, B., Maisupova, B. and Kelgenbayev, N. 2017. Drought variations in Almaty (Kazakhstan) since AD 1785 based on spruce tree rings. Stochastic Environmental Research and Risk Assessment 31: 2097-2105.
Climate alarmists typically contend that in response to global warming, extreme weather events such as drought will become more frequent and severe. It is therefore important to determine if long-term drought data from various places throughout the world provide any evidence for this contention.
Our latest review to shed some light on this subject comes from the work of Chen et al. (2017), who prepared a 230-year drought history Almaty, Kazakhstan. This was accomplished through statistical examination of tree rings cored from Schrenk spruce trees (Picea schrenkiana) within a 60-km radius of Almaty, which rings were found to correlate well with an index of mean August-January moisture (the Standardized Precipitation Evapotranspiration Index, SPEI, calculated as the difference between precipitation and potential evaporation).
The resultant proxy, covering the years 1785-2014, is presented in the figure below. As seen there, the reconstruction reveals the presence of interannual and multi-decadal periodicities, which the authors confirmed by spectral and wavelet analyses. The most severe droughts, denoted by SPEI values ≥2 standard deviations above the long-term mean, occurred in AD 1808, 1829, 1850, 1879, 1911, 1917 and 1945. In contrast, no year in the 230-year record met the criteria for an extremely wet year (≥2 SD).
In viewing the entire reconstruction, one characteristic is rather obvious, there is nothing unusual, unnatural or unprecedented about the drought record of the past few decades, except perhaps that it appears to be less variable and less severe. Thus, if there has been a CO2-induced influence on the drought record, it surely has been a favorable one.
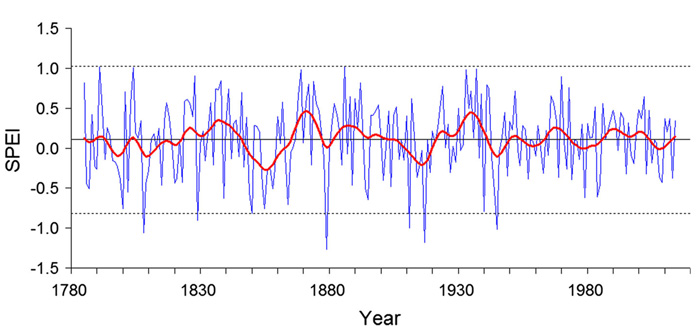
Figure 1. Estimated (blue line) and 15-year low-pass filter (red line) values of mean August-January SPEI of Almaty. Central horizontal line shows the mean of the estimated values; the dotted lines two standard deviations. Source: Chen et al. (2017).