| Follow @co2science |
Paper Reviewed
Cheng, L., Zhang, L., Wang, Y.-P., Canadell, J.G., Chiew, F.H.S., Beringer, J., Li, L., Miralles, D.G., Piao, S. and Zhang, Y. 2017. Recent increases in terrestrial carbon uptake at little cost to the water cycle. Nature Communications 8: 110, DOI:10.1038/s41467-017-00114-5.
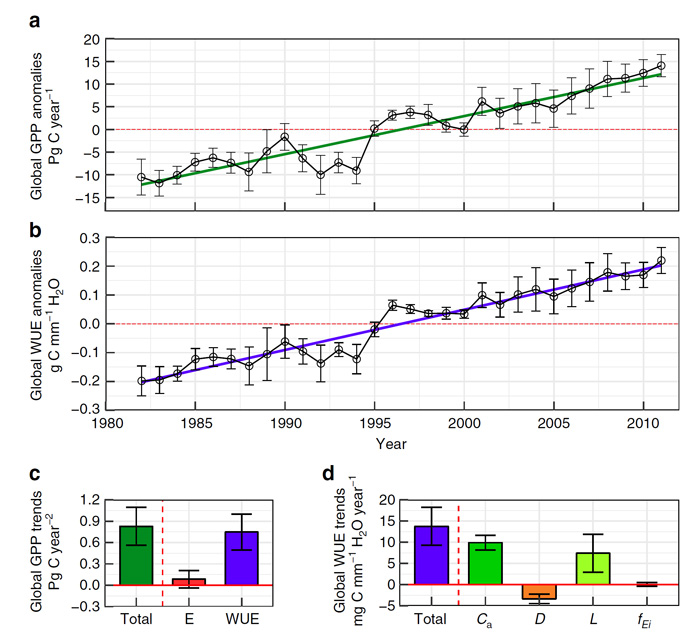
In a recent review we documented the work of Li et al. (2017), who utilized a series of globally-distributed databases to calculate there has been a 21.5 percent increase in global terrestrial net primary production (NPP) over the past half century, thanks in large measure to the growth-enhancing, water-saving and stress-ameliorating benefits of atmospheric CO2 enrichment. Now, following on the heels of that study is the equally intriguing work of Cheng et al. (2017), who present similar findings with respect to global terrestrial carbon uptake (i.e., gross primary production, or GPP). Using a combination of ground-based and remotely sensed land and atmospheric observations, this group of ten researchers performed a series of calculations to estimate changes in global GPP, water use efficiency (WUE) and evapotranspiration (E) over the period 1982 to 2011. Results of the analysis are shown in the figures below.
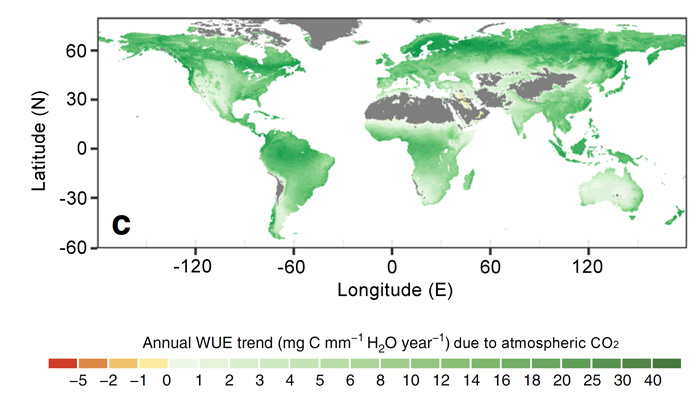
With respect to the temporal change in global GPP, Cheng et al. estimate it has increased by 0.83 ± 0.26 Pg C per year, or a total of 24.9 Pg C over the past three decades (Figure 1a, c). Global WUE also "increased at a mean rate of 13.7 ± 4.3 mg C mm-1 H2O per year from 1982 to 2011 (p < 0.001), which is about 0.7 ± 0.2% per year of mean annual WUE" (Figure 1b, c). Global E, on the other hand, experienced a non-significant very small increase of 0.06 ± 0.13% per year (Figure 1c). Thus, both WUE and E were found to "positively contribute to the estimated increase in GPP," though the contribution from WUE accounted for 90 percent of the total GPP trend. Consequently, Cheng et al. conclude that the "estimated increase in global GPP under climate change and rising atmospheric CO2 conditions over the past 30 years is taking place at no cost of using proportionally more water, but it is largely driven by the increase in carbon uptake per unit of water use, i.e. WUE" (see Figure 2).
With respect to what might explain the increasing WUE trend, Cheng et al. examined the relative contribution of four possible factors, including rising atmospheric CO2, vapor pressure deficit, leaf area index and the fraction of canopy radiation interception to total ecosystem water use. This effort revealed, as shown in Figure 1d, that atmospheric CO2 enrichment and leaf area index (which parameter has itself been shown to be linked to elevated CO2) are responsible for the lion's share of the trend.
From a spatial point of view, Cheng et al. additionally report that 82 percent of the global vegetated land area show positive trends in GPP despite "the large-scale occurrence of droughts and disturbances over the study period" (Figure 2a). Similarly, ecosystem WUE was found to increase in 90 percent of the world's vegetative areas; and there was a high correlation between the spatial trends in these two parameters.
Commenting on their several findings, Cheng et al. write that their results show that "terrestrial GPP has increased significantly and is primarily associated with [an] increase in WUE, which in turn is largely driven by rising atmospheric CO2 concentrations and [an] increase in leaf area index." However, they add that "the most important driver for the increases in GPP and WUE from 1982 to 2011 is rising atmospheric CO2." And in this regard, they note that a 10% increase in atmospheric CO2 induces an approximate 8% increase in global GPP and a 14% increase in global WUE.
And so it is that the increase in terrestrial carbon uptake over the past three decades benefited from the ongoing rise in atmospheric CO2. What is more, this increase has not come at a cost of enhanced global terrestrial water use. Instead, rising atmospheric CO2 has improved the global carbon uptake per unit of water use, which finding holds extremely important ramifications for the future survival of both plant and animal species.
Atmospheric CO2, it truly is the elixir of life!

Figure 1. Estimated trends in global gross primary production (GPP) and water use efficiency (WUE) and their drivers over 1982-2011. Annual mean anomalies (with linear trend line) and associated standard deviations of (panel a) global GPP and (panel b) global WUE. (Panel c) Contribution of evapotranspiration (E) and WUE to total global trends in GPP (Total). (Panel d) Contributions of atmospheric CO2 concentration (Ca), vapor pressure deficit (D), leaf area index (L) and fraction of canopy interception (fEi) to total ecosystem water use to the total increase in global WUE (Total). Source: Cheng et al. (2017).

Figure 2. Estimated spatial variations of the contributions to trends of ecosystem water use efficiency (WUE) from atmospheric CO2 concentration over 1982-2011. Source: Cheng et al. (2017).

Figure 3. Estimated spatial trends in annual gross primary production (panel a) and water use efficiency (panel b) over 1982-2011. Source: Cheng et al. (2017).
Reference
Li, P., Peng, C., Wang, M., Li, W., Zhao, P., Wang, K., Yang, Y. and Zhu, Q. 2017. Quantification of the response of global terrestrial net primary production to multifactor global change. Ecological Indicators 76: 245-255.


