


| Follow @co2science |
Paper Reviewed
Keenan, T.F., Prentice, C., Canadell, J.G., Williams, C.A., Wang, H., Raupach, M. and Collatz, G.J. 2016. Recent pause in the growth rate of atmospheric CO2 due to enhanced terrestrial carbon uptake. Nature Communications DOI: 10.1038/ncomms13428.
The seven authors of this intriguing paper -- hailing from four different countries (Australia, China, the UK and the United States) -- begin their report by noting that the CO2-induced increasing growth rates of the many plants of earth's terrestrial ecosystems successfully "offset a large fraction of anthropogenic CO2 emissions," which phenomenon stunts the growth rate of the atmosphere's CO2 concentration. So how have earth's plants done to date in this grandiose activity?
Keenan et al. report that "using global carbon budget estimates, ground, atmospheric and satellite observations, and multiple global vegetation models," they were able to identify "a recent pause in the growth rate of atmospheric CO2," and "a decline in the fraction of anthropogenic emissions that remain in the atmosphere," all of which has occurred "despite increasing anthropogenic [CO2] emissions." And this observation suggests that nations need not fret over the ongoing increase in the atmosphere's CO2 concentration, for CO2 is truly the elixir of life, both for plants themselves and, indirectly, all of the planet's animal and human life as well.
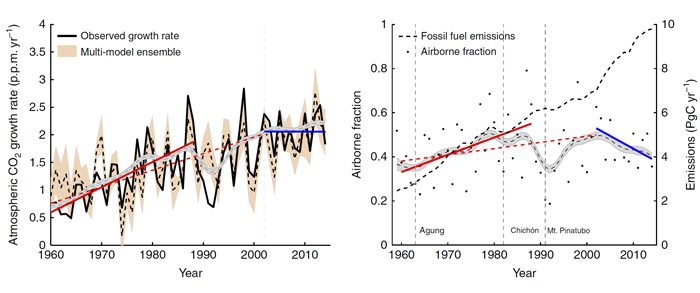
Figure 1. Changes in the airborne fraction and the CO2 growth rate. (Left Panel) Observed (solid black line) and modelled (DGVM ensemble-mean (dashed black line) and s.d. (orange area)) changes in the atmospheric CO2 growth rate from 1960 to 2012. The vertical grey line (2002) indicates the point of structural change identified using a linear modelling analysis. The red lines indicate a significant increasing trend from 1959 to 1990 (solid red) and 1959 to 2002 (dashed red) (P<0.1), with no trend evident between 2002 and 2014 (blue). All trends were estimated using a non-parametric Mann-Kendall Tau trend test with Sen's method. The grey area represents the underlying 5-year dynamic (mean±1 s.d.), estimated using SSA. (Right Panel) Fossil fuel emissions (black dashed line) and the fraction of CO2 emissions, which remain in the atmosphere each year (black dots, airborne fraction). Lines indicate significant long-term trends over the periods 1959-1988 (red, increasing) and 2002-2014 (blue, decreasing) at P<0.1. The red dashed line shows a slight increasing trend between 1959 and 2002 (P=0.18). The grey area represents the underlying 5-year dynamic (mean±1 s.d.), estimated using singular spectrum analysis. Source: Keenan et al. (2016).